How to even the score: an investigation into how native and Arab non-native teachers of English
rate essays containing short and long sentences.
By
Saleh Ameer
A dissertation submitted in fulfilment of the requirements for the degree of Doctor of Philosophy
(Education) in The University of Sheffield 2015.
I certify that all material in this thesis which is not my own work has been identified and that no
material has previously been submitted and approved for the award of a degree by this or any other
University.
Signature:…………………………………………………………………….
Contents
Acknowledgments ……………………………………………………………………………………………………………………
List of tables ……………………………………………………………………………………………………………………………..
List of figures …………………………………………………………………………………………………………………………….
List of appendices ……………………………………………………………………………………………………………………..
ABSTRACT …………………………………………………………………………………………………………………………………
CHAPTER 1: INTRODUCTION …………………………………………………………………………………………………….
CHAPTER 2: LITERATURE REVIEW (THEORETICAL OVERVIEW) …………………………………………………….
2.1 Validation of writing assessment …………………………………………………………………………………….
2.1.1 A Priori validity argument ………………………………………………………………………………………….
2.1.2 A Posteriori validity argument ……………………………………………………………………………………
2.1.3 Major threats to validity ……………………………………………………………………………………………
2.2 Assessment Use Argument (AUA) …………………………………………………………………………..
2.2.1 Claim 1 ……………………………………………………………………………………………………………………..
2.2.2 Claim 2 ……………………………………………………………………………………………………………………..
2.2.3 Claim 3 ……………………………………………………………………………………………………………………..
2.2.4 Claim 4 ……………………………………………………………………………………………………………………..
2.3 The importance of writing assessment …………………………………………………………………….
2.4 Timed Essay assessment …………………………………………………………………………………………………..
2.5 ‘Direct’ and ‘indirect’ writing assessment …………………………………………………………………………
2.6 Rating scales in ‘direct’ assessment ………………………………………………………………………………….
2.7 Rater variance in ‘direct’ assessment ……………………………………………………………………………….
2.8 Rater variance due to experiential factors ………………………………………………………………………
2.9 Overcoming rater variance ………………………………………………………………………………………………
2.9.1 The standard approach ………………………………………………………………………………………………
2.9.2 The measurement approach ……………………………………………………………………………………..
2.10 Chapter 2 summary ………………………………………………………………………………………………………
CHAPTER 3: LITERATURE REVIEW (RESEARCH OVERVIEW) …………………………………………………………
3.1 Error gravity studies ………………………………………………………………………………………………………
3.1.1 NES and NNS evaluation of errors in sentences ………………………………………………………
3.1.2 NES and NNS evaluation of errors in authentic texts ………………………………………………
3.2 NES and NNS evaluation of authentic written work ……………………………………………………
3.3 Empirical studies using the Multi-Faceted Rasch Measurement ……………………………………
3.4 Qualitative studies of rater variation: The decision-making process…………
3.5 Sentence length in English and Arabic writing ……………………………………………………………..
3.6 Summary of the major findings in Chapter 3 ………………………………………………………………..
3.7 Chapter 3 summary ………………………………………………………………………………………………………
CHAPTER 4: METHODOLOGY …………………………………………………………………………………………………..
4.1. Research design ………………………………………………………………………………………………………….
4.2. Research Questions and hypotheses …………………………………………………………………………….
4.3 Participants and setting ………………………………………………………………………………………………..
4.3.1 Participants and setting overview …………………………………………………………………………..
4.3.2 The NES participants ……………………………………………………………………………………………….
4.3.3 The NNS participants ……………………………………………………………………………………………….
4.4 Instruments ……………………………………………………………………………………………………………………
4.4.1 The written scripts …………………………………………………………………………………………………..
4.4.2 The Coh-Metrix tool …………………………………………………………………………………………………
4.4.3 The rating scale ………………………………………………………………………………………………………..
4.4.4 The instructions ………………………………………………………………………………………………………..
4.4.5 Interviews …………………………………………………………………………………………………………………
4.5 Procedure ……………………………………………………………………………………………………………………..
4.5.1 Data collection ……………………………………………………………………………………………………….
4.5.2 Data reduction: Coding ……………………………………………………………………………………………
4.5.3 Data analysis ………………………….………………………………………………………………………………
4.6 Pilot study ………………………………………………………………………………………………………………………
4.7 Ethical considerations ……………………………………………………………………………………………………
4.8 Chapter 4 summary …………………………………………………………………………………………………
CHAPTER 5: RESULTS, ANALYSIS and DISCUSSION …………………………………………………
5.1 Inter-rater reliability ……………………………………………………………………………………………….
5.2 The Coh-Metrix results ……………………………………………………………………………………………
5.3 Time spent scoring the scripts …………………………………………………………………………………
5.4 Number of times scripts were read before scoring ……………………………………………………
5.5 Cluster Analysis ………………………………………………………………………………………………………
5.5.1 Cluster analysis for raters ……………………………………………………………………………………
5.5.2 Cluster analysis of written scripts ………………………………………………………………………….
5.6 Research question 1 …………………………………………………………………………………………………..
5.6.1 Research question 1.1 ……………………………………………………………………………………
5.6.2 Research question 1.2 ………………………………………………………………………………
5.7 research question 2 ……………………………………………………………………………………………
5.8 research question 3 …………………………………………………………………………………………
5.9 Research question 4 …………………………………………………………………………………………………
5.9.1 Research question 4.1 ………………………………………………………………………………
5.9.2 Research question 4.2 ……………………………………………………………………………
5.9.3 Research question 4.3 ……………………………………………………………………………………
5.9.4 Research question 4.4 ………………………………………………………………………………………
5.10 Interviews I ………………………………………………………………………………………………………………
5.11 Interviews II ………………………………………………………………………………………………………………
5.11.1 Rater biases and sentence length …………………………………………………………………………….
5.11.2 Rater biases and sentence length awareness …………………………………………………………
5.11.3 Rater biases and sentence length preference, and teaching instruction ……………………
5.12 Chapter 5 summary ………………………………………………………………………………………………
CHAPTER 6: CONCLUSION …………………………………………………………………………………………………
6.1 Summary of the investigation …………………………………………………………………………………
6.2 Limitations ………………………………………………………………………………………………………………
6.3 Implications ………………………………………………………………………………………………………………
6.4 Areas of further research …………………………………………………………………………………………
6.5 Chapter 6 summary ……………………………………………………………………………………………………
REFERENCES ………………………………………………………………………………………………………………………
APPENDICIES ……………………………………………………………………………………………………
Acknowledgments
I am truly grateful to the many people who made the completion of this dissertation possible. First and foremost, I would like thank my wonderful family for all the support, love, encouragement and patience they have shown. Starting with the love of my life, my beautiful wife Zahra’a; my eldest daughter (and my best friend) Noor; my second daughter (and the kindest girl in the whole word) Maria; and the heir to my throne: Ali (the jolliest boy in the whole world). I would also like to thank my mother too for all her kind and unconditional support along with my sister Zahra. These are the people who had to put up with me the most during the last 4 years or so. I honestly do not know how they managed. I certainly would not put up with me.
I also appreciate the time and effort given by my supervisors Dr Oksana Afitska and Dr Robyn Orfitelli. In addition, I am also greatly in debt to the staff of Language Testing in Lancaster (summer course 2015) for all the valuable technical feedback and input they provided; Dr Luke Harding, Dr Tineke Brunfaut, Dr Rita Green, Kathrin Eberharter and Carol Spoettl. I would also like to thank Professor Cyril Weir, who not only is one of my greatest inspirations, but also kindly provided me with much critical feedback and input. Similarly, I would like to thank Dr Guoxing Yu who also provided valuable input in the early stages of this dissertation. Moreover, this dissertation involved a statistical procedure that is unfamiliar to many statisticians- the Multi-Faceted Rasch Analysis, and without the guidance of Dr Rita Green, I would not have been able to analyse my data. Dr Mike Linacre and Dr William Boone were also very supportive and helpful in my data analysis. Dr Aysha Bey provided me with invaluable input on Arabic sentence length and matters pertinent to Arabic writing.
The British Council in Kuwait, along with many staff members, (especially Nadir Khan and Cathy) were also instrumental in this dissertation, and without them I would have not completed this thesis. I would like to express my gratitude to the Public Authority for Applied Education and Training- Kuwait for awarding me this fully-funded scholarship. Also, I would like to express my gratitude to 3 head teachers of various high schools in Kuwait, who wish to remain anonymous, for all the help they provided in my data collection. Last but not least, I would like to thank the other love of my life, Arsenal Football Club for winning back-to-back FA cups. Going 9 years (2005- 2014) without winning a trophy was extremely depressing but their subsequent victories greatly improved my academic output. I am grateful that they made amends when it mattered most. At the time of writing, Arsenal FC sit proudly at the top of the Premier League table with Manchester United 6th and Chelsea 14th (19 points behind the soon to be champions so far). Finally, I thank Tottenham Hotspurs Football Club for being utterly insignificant, consistently finishing below Arsenal, and being where every football fan expects them to be, namely, in Arsenal’s shadow.
List of tables
Table 2.1 Summary of the differences between ‘direct’ and ‘indirect’ assessment.
Table 2.2 Summary of holistic and analytic scales advantages and disadvantages.
Table 2.3 Hypothetical scores of Maria and Ali.
Table 2.4 Hypothetical scores of Maria, Ali, Zahra and Noor.
Table 3.1 Summary of the differences between English and Arabic sentences.
Table 3.2 Summary of the major findings of the literature in Chapter 3.
Table 4.1 NES raters’ profiles.
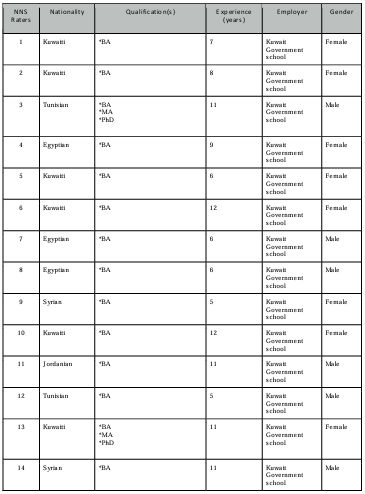
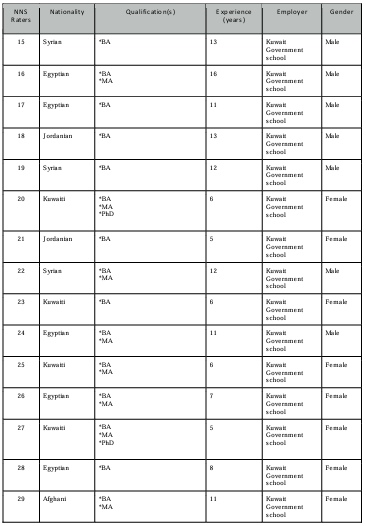
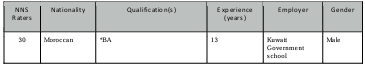
Table 4.2 NNS raters’ profiles.
Table 4.3 Amount of time spent on each interview.
Table 5.1 NES and NNS interclass Correlation Coefficients.
Table 5.2 The Coh-Metrix indices for short and long scripts.
Table 5.3 Scripts with short sentences cluster groups.
Table 5.5 Scripts with long sentences cluster groups.
Table 5.6 All the scripts’ cluster groups.
Table 5.7 Rater Measurement report.
Table 5.8 Rater pairwise comparisons of overall score.
Table 5.9 Rating scale functioning.
Table 5.10 Script Measurement Report.
Table 5.11 Raters’ unexpected responses.
Table 5.12 Rating scale functioning report for the NES.
Table 5.13 NES unexpected responses.
Table 5.14 NES Rater Measurement Report.
Table 5.15 Rating scale functioning report for the NNS.
Table 5.16 NNS unexpected responses.
Table 5.17 NNS Rater Measurement report.
Table 5.18 Summary of the major findings in Research Question 1.
Table 5.19 Unique NES rater x script bias patterns.
Table 5.20 Unique NNS rater x script bias patterns.
Table 5.21 Summary of the significant differences in rater x criteria pairwise comparisons.
Table 5.22 Rater x script x Task achievement significant bias interactions.
Table 5.23 Rater x script x Coherence and cohesion significant bias interactions.
Table 5.24 Rater x script x Lexical resource significant bias interactions.
Table 5.25 Rater x script x Grammatical range and accuracy significant bias interactions.
Table 5.26 Interviews’ coded categories.
Table 5.27 Summary of interviews.
List of figures
Figure 2.1 Writing assessment validation framework.
Figure 2.2 Main methods of writing assessment.
Figure 2.3 Standard approach to dealing with rater variance.
Figure 2.4 Facets other than writing ability that can contribute to variation in test scores.
Figure 5.1 Dendrogram of cluster groups for scripts with short sentences.
Figure 5.2 Mean averages of the clusters for scripts with short sentences.
Figure 5.3 Scripts with short sentences clusters’ box-and-whiskers plot.
Figure 5.4 Dendrogram of cluster groups for scripts with long sentences.
Figure 5.5 Mean averages of the clusters for scripts with long sentences.
Figure 5.6 Scripts with long sentences clusters’ box-and-whiskers plot.
Figure 5.7 Dendrogram of cluster groups for all the scripts.
Figure 5.8 Mean averages of the clusters for all the scripts.
Figure 5.8 All scripts clusters’ mean averages.
Figure 5.9 All scripts clusters’ distribution on the scripts with short sentences.
Figure 5.10 All scripts clusters’ distribution on the scripts with long sentences.
Figure 5.11 NES line chart for all the scores awarded.
Figure 5.12 NNS line chart for all the scores awarded.
Figure 5.13 Scripts’ clusters based on the Coh-Metrix indices.
Figure 5.14 MFRM Vertical Ruler.
Figure 5.15 NES Vertical Ruler.
Figure 5.16 NNS Vertical Ruler.
Figure 5.17 NES rater x script bias interaction.
Figure 5.18 NNS rater x script bias interaction.
Figure 5.19 Rater script bias interaction.
Figure 5.20 Rater x criteria bias interaction.
Figure 5.21 Rater x criteria significant bias interactions.
List of appendices
Appendix 1 Information letter and consent.
Appendix 2 Participants’ questionnaire- Background.
Appendix 3 Analytic rating scale.
Appendix 4 Participants’ task.
Appendix 5 NES raters’ profiles.
Appendix 6 NNS raters’ Profiles.
Appendix 7 Script 1 (with Coh-Metrix indices) (CD attachment).
Appendix 8 Script 2 (with Coh-Metrix indices) (CD attachment).
Appendix 9 Script 3 (with Coh-Metrix indices) (CD attachment).
Appendix 10 Script 4 (with Coh-Metrix indices) (CD attachment).
Appendix 11 Script 5 (with Coh-Metrix indices) (CD attachment).
Appendix 12 Script 6 (with Coh-Metrix indices) (CD attachment).
Appendix 13 Script 7 (with Coh-Metrix indices) (CD attachment).
Appendix 14 Script 8 (with Coh-Metrix indices) (CD attachment).
Appendix 15 Script 9 (with Coh-Metrix indices) (CD attachment).
Appendix 16 Script 10 (with Coh-Metrix indices) (CD attachment).
Appendix 17 Script 11 (with Coh-Metrix indices) (CD attachment).
Appendix 18 Script 12 (with Coh-Metrix indices) (CD attachment).
Appendix 19 Script 13 (with Coh-Metrix indices) (CD attachment).
Appendix 20 Script 14 (with Coh-Metrix indices) (CD attachment).
Appendix 21 Script 15 (with Coh-Metrix indices) (CD attachment).
Appendix 22 Script 16 (with Coh-Metrix indices) (CD attachment).
Appendix 23 Script 17 (with Coh-Metrix indices) (CD attachment).
Appendix 24 Script 18 (with Coh-Metrix indices) (CD attachment).
Appendix 25 Script 19 (with Coh-Metrix indices) (CD attachment).
Appendix 26 Script 20 (with Coh-Metrix indices) (CD attachment).
Appendix 27 Script 21 (with Coh-Metrix indices) (CD attachment).
Appendix 28 Script 22 (with Coh-Metrix indices) (CD attachment).
Appendix 29 Script 23 (with Coh-Metrix indices) (CD attachment).
Appendix 30 Script 24 (with Coh-Metrix indices) (CD attachment).
Appendix 31 Interview 1 (NES) transcript (CD attachment).
Appendix 32 Interview 2 (NES) transcript (CD attachment).
Appendix 33 Interview 3 (NES) transcript (CD attachment).
Appendix 34 Interview 4 (NES) transcript (CD attachment).
Appendix 35 Interview 5 (NNS) transcript (CD attachment).
Appendix 36 Interview 6 (NNS) transcript (CD attachment).
Appendix 37 Interview 7 (NNS) transcript (CD attachment).
Appendix 37 Participant consent form (CD attachment).
Appendix 38 Clusters’ image plot for scripts with short sentences (CD attachment).
Appendix 39 Clusters’ image plot for scripts with long sentences (CD attachment).
Appendix 40 Coh-Metrix summary (CD attachment).
Appendix 41 Information letter and consent II (CD attachment).
Appendix 42 Interview II rater biases table (CD attachment).
Appendix 43 Semi-structured interview schedule (CD attachment).
Appendix 44 Main categories, codes and sub-codes of interview II (CD attachment).
Appendix 45 Interview II raw scores on each script (CD attachment).
Appendix 46 Interview II transcript (rater 61 NNS) (CD attachment).
Appendix 47 Interview II transcript (rater 62 NNS) (CD attachment).
Appendix 48 Interview II transcript (rater 63 NNS) (CD attachment).
Appendix 49 Interview II transcript (rater 64 NNS) (CD attachment).
Appendix 50 Interview II transcript (rater 65 NNS) (CD attachment).
Appendix 51 Interview II transcript (rater 66 NNS) (CD attachment).
Appendix 52 Interview II transcript (rater 67 NNS) (CD attachment).
Appendix 53 Interview II transcript (rater 68 NNS) (CD attachment).
Appendix 54 Interview II transcript (rater 69 NNS) (CD attachment).
Appendix 55 Interview II transcript (rater 70 NNS) (CD attachment).
Appendix 56 Interview II transcript (rater 71 NES) (CD attachment).
Appendix 57 Interview II transcript (rater 72 NES) (CD attachment).
Appendix 58 Interview II transcript (rater 73 NES) (CD attachment).
Appendix 59 Interview II transcript (rater 74 NES) (CD attachment).
Abstract
In the field of education, test scores are meant to provide an indication of test-takers’ knowledge or abilities. The validity of tests must be rigorously investigated to ensure that the scores obtained are meaningful and fair. Owing to the subjective nature of the scoring process, rater variation is a major threat to the validity of performance-based language testing (i.e., speaking and writing). This investigation explores the influence of two main effects on writing test scores using an analytic rating scale. The first main effect is that of raters’ first language (native and non-native). The second is the average length of sentences (essays with short sentences and essays with long sentences). The interaction between the main effects will also be analyzed. Sixty teachers of English as a second or foreign language (30 natives and 30 non-natives) working in Kuwait, used a 9-point analytic rating scale with four criteria to rate 24 essays with contrasting average sentence length (12 essays with short sentences on average and 12 with long sentences). Multi-Facet Rasch Measurement (using FACETS program, version 3.71.4) showed that: (1) the overall scores awarded by raters differed significantly in severity; (2) there were a number of significant bias interactions between raters’ first language and the essays‘ average sentence length; (3) the native raters generally overestimated the essays with short sentences by awarding higher scores than expected, and underestimated the essays with long sentences by awarding lower scores than expected. The non-natives displayed the reverse pattern. This was shown on all four criteria of the analytic rating scale. Furthermore, there was a significant interaction between raters and criteria, especially the criterion ‚Grammatical range and accuracy‘. Two sets of interviews were subsequently carried out. The first set had many limitations and its findings were not deemed adequate. The second set of interviews showed that raters were not influenced by sentence length per se, but awarded scores that were higher/lower than expected mainly due to the content and ideas, paragraphing, and vocabulary. This focus is most likely a result of the very problematic writing assessment scoring rubric of the Ministry of Education-Kuwait. The limitations and implications of this investigation are then discussed.
Chapter I
Introduction
For over a century language testers have had serious concerns over the validity of test scores on performance-based language assessment (Edgeworth, 1890, cited in Weir, 2013). Testing the skills of writing and speaking naturally entails a performance from the test-taker. This performance is then rated (awarded a score) by a human rater, bringing an element of subjectivity to the assessment setting; scores from a group of different raters on the same performance vary from rater to rater (rater variance). Hamp-Lyons (2007) asserts that for many years “writing assessment has been plagued by concerns about the reliability of rating (which usually means the reliability of the raters)” (p. 1, emphasis in original). Human ratings have long been deemed inconsistent and thus the usefulness and fairness of their ratings (scores they award) have always been questionable (Diederich et al., 1961). This led many testers, especially in the United States (US), to abandon performance-based assessment (direct assessment) in favour of more objective forms of assessment (indirect assessment), like multiple-choice questions (Crusan, 2010; Hamp-Lyons, 1991). It was argued that these objective forms of assessment were: (1) far more reliable, (2) tapped into the various micro-skills of writing, (3) correlated highly with writing ability, and (4) more practical to administer and score (De Mauro, 1992). However, this came at the expense of various forms of test validity and had a number of negative and unintended consequences on teachers and learners. This form of assessment (indirect or objective) encouraged test-takers to learn only the micro-skills of writing, like vocabulary and grammar, along with test-taking strategies, as opposed to engaging in the act of writing in preparation for the test(s). This led to a decline in literacy skills (Crusan, 2010; Hamp-Lyons, 1991). Moreover, scores on those indirect tests (objective) did not tell test administrators or stakeholders what test-takers can/cannot do in terms of writing. As a result, performance-based assessment regained popularity in most language testing settings where speaking and writing are now frequently tested directly.
However, the matter of rater variance continues to be an issue that hinders test scores’ validity and testers need to take this matter into consideration if test scores are to be meaningful, useful and fair. In other words, if we were to adopt the views of Messick (1989), Bachman (1990), Kane (2002) and Weir (2005), that validity is an argument and that test validation is the process of gathering evidence to support inferences we make from test scores, then testers need to provide evidence that the scores awarded by raters on tests of writing (or speaking) were not influenced by the raters. This evidence is crucial, and contributes greatly to the scoring validity argument of a writing test. More precisely, such evidence illustrates that the scores are construct-relevant for the most part, that is, variance in scores is due to variance in the test-takers’ ability in the construct that the test is designed to measure. McNamara (1996 and 2000) outlines various ways in which raters may vary: (1) they may not be self consistent in their ratings (intra-rater reliability), (2) they may systematically differ in their overall severity, (3) they may systematically be more severe when they interact with other factors (e.g.,test taker, task, rating scale, time), and (4) they may differ in their interpretation of the rating scale.
These differences could be due to any number of factors. Some of the factors that have been investigated include:
• experience- that is, studies of novice and/or experienced raters’ evaluation of L1 and L2 writing (Barkaoui, 2011; Breland and Jones, 1984; Connor and Carrel, 1993; Cumming, 1989 and 1990; Hout, 1988; Keech and McNelly, 1982 cited in Ruth and Murphy, 1988; Sweedler Brown, 1985),
• specialty- that is, comparing language teachers’ ratings to subject/content area specialists’ ratings (Bridgeman and Carlson, 1983; Brown, 1991; Elder, 1992; Hamp-Lyons, 1991; Mendelson and Cumming, 1987; O’Loughlin, 1992; Santos, 1988; Song and Caruso, 1996; Sweedler-Brown; Weir, 1983),
• analysis of features of writing that influence raters’ overall judgments (Connor-Linton, 1995b; Lumely, 2002; Shi, 2001; Vaughan, 1991),
• influence of rater training (O’Sullivan and Rignal, 2007; Shohamy et al., 1992; Weigle, 1994, 1998),
• raters’ expectations (Diederich, 1974; Powers et al., 1994; Stock and Robinson, 1987).
One of the most salient factors that require investigation is that of raters’ language background in relation to test-takers’ language background (Johnson and Lim, 2009; Winke et al., 2012). In the field of speaking assessment, for example, Winke et al. (2012) investigated whether raters who were familiar with test-takers’ accent (sharing their L1) would score those test-takers more favourably compared to test-takers with different language backgrounds (accents). They found that accent familiarity resulted in systematic and statistically significant more lenient ratings.
In the field of writing assessment, a number of studies have investigated the influence of raters’ native status on their rating performance. That is, native speakers of English (NES) compared to non native speakers of English (NNS). Some of those studies compared how each group perceived written errors in erroneous sentences (James, 1977; Hughes and Lascaratou, 1982; Davies, 1983; Green and Hecht, 1985; Sheory, 1986; Santos, 1988; Hyland and Anan, 2006). Others have focused on how NES and NNS rate authentic scripts of writing (Connor-Linton, 1995b; Johnson and Lim, 2009; Lee, 2009; Shi, 2001). Also, the influence of familiarity with test-takers’ rhetorical patterns was the focus of a number of other studies (Hinkel, 1994; Kobayashi and Rinnert, 1996; Land and Whitely,
1989).
There is no literature that investigates the behaviour of Arab teachers of English when they rate writing compared with NES. Only Davies (1983) included Arabs in his investigation, however, his raters were solely from Morocco. More importantly, they were only compared to NES in their perception of error gravity- that is, how each group perceived errors in erroneous sentences. There was no comparison of their actual rating of written work. The NNS in previous investigations have hailed from East Asia (Connor-Linton, 1995b; Hinkel, 1994; Johnson and Lim, 2009; Kim and Gennaro, 2012; Kobayashi and Rinnert, 1996; Kondo-Brown, 2002; Lee, 2009; Shi, 2001); Spain (Johnson and Lim, 2009); Germany (Green and Hetch, 1985); and Brazil, Poland and Mexico (Kim and Gennaro, 2012). Moreover, the majority of studies incorporated a very small number of NNS who rated a large number of written scripts. This resulted in a very clear image of individual rater behaviour, but no generalizations could be formed of group patterns.
In addition, some of the previous studies had investigated the transfer of test-takers’ (students, writers) L1 rhetorical features to their writing in English, and the influence this had had on raters of various backgrounds when scoring the writing (e.g., Hinkel, 194; Kobayashi and Rinnert, 1996; Shi, 2000). However, the features investigated were pertinent to Japanese L1. There are few studies that investigate the transfer of Arabic rhetorical features to English writing and the influence this may have on raters from various backgrounds (NES and NNS). Sentence length is a unique characteristic of the Arabic language. Sentences in Arabic are generally much longer than found in English; they comprise 20-30 words on average, and can reach up to 100 words per sentence (Al-Taani et. al., 2012; Othman, et al., 2004). It has not yet been established how this influences Arabs when writing in English and whether Arab test-takers (students/writers) produce overly long sentences in English. More importantly, if this is the case, how would this influence the rating behaviour of raters from diverse backgrounds (NES and NNS)?
One of the most frequently used methods when investigating rater variance and dealing with the issue, especially in high-stakes tests, is the Multi-Facet Rasch Measurement (MFRM), developed by Mike Linacre (1989). MFRM has been used to investigate rater variance in rating writing in English as a first language (Engelhard, 1992 and 1994), as a second or foreign language (Johnson and Lim, 2009; McNamara, 1996; Li, 2009), as well as foreign languages like German (Eckes, 2011 and 2012) and Japanese (Kondo-Brown, 2002). MFRM takes into account various factors (called facets) in the assessment setting that could contribute to variations in scores such as raters (and their severity degrees), task difficulty, rating scale criteria and test-takers’ ability (Bond and Fox, 2007; Eckes,
2011), to produce a ‘fair score’. It is also extensively used in rater training to provide raters with feedback on their rating behaviour (Lumley and McNamara, 1995; McNamara, 1996; Weigle, 1998). Moreover, rater severity is a complex issue that can change according to other facets. That is, raters may interact with other facets in the assessment setting (e.g., test-taker, criteria, task, time) and this interaction could result in systematic bias patterns (systematically overestimating or underestimating). MFRM can investigate and identify these patterns (Barkaoui, 2014). For example, raters’ severity degrees may consistently change in an identifiable pattern when they interact with particular test-takers (Lynch and McNamara, 1998; Li, 2009), specific criteria (Eckes, 2012; McNamara, 1996; Wiggles worth, 1993), or even a particular time of rating, e.g early morning or late evening (Lumley and Mc Namara , 1995). McNamara (1996) believes that MFRM could be used for two purposes: research purposes and practical purposes. The former refers to the investigation of rater behaviour to increase our understanding of how they rate performances and how they may systematically differ. Questions pertaining to which raters are systematically more severe, when are they are systematically more severe, to whom they are more severe, etc., are explored for research purposes. These contribute to our theoretical understanding of rater behaviour, and by extension, to systematic rater variance. The latter refers to using the MFRM to aid in rater training and also in operational testing by adjusting test scores and producing ‘fair scores’ that factor in the influence of
the various identified facets. This investigation predominantly utilizes MFRM for research purposes.
Moreover, the present study is set in the context of Kuwait, where improving the standard of English language learning has been a primary aim of the Ministry of Education for over two decades. English is a compulsory subject in all primary schools funded by the Kuwaiti Government and students continue to be taught English until they reach college and/or university level. Although it is taught on a daily basis for approximately 50 minutes, it is not uncommon for students to attend privately funded educational institutes like the British Council in Kuwait, to further improve their proficiency.
This is especially true for students seeking to obtain degrees abroad in countries such as Great Britain and the United States. The British Council in Kuwait offers various taught general English courses that aim to improve students’ general level of proficiency in English in all four skills (reading, writing, listening and speaking). The levels offered by the Council are Beginner (level 1, 2 and 3), Pre intermediate (level 1, 2, and 3), Intermediate (level 1, 2 and 3), Upper-intermediate (level 1 and 2) and Advanced (level 1, 2 and 3). The British Council in Kuwait also offers specific courses aimed at helping students achieve satisfactory scores on the International English Language Testing System (IELTS), a test that no fewer than 1000 Kuwaiti students take per year. The majority of EFL teachers in all governmental institutes (schools, colleges, universities) are NNS from countries such as Egypt,
Syria, Kuwait and others. The private institutes, on the other hand, mainly consist of EFL teachers from countries like Great Britain, the United States, Australia and Canada. It is very uncommon for the two groups to work collaboratively in either teaching or testing. Furthermore, there is a growing concern, according to Weigle (2007, p.194) that many EFL teachers have not taken any courses in language assessment as part of their formal qualification(s), and that the ‘teaching writing’ courses they have undergone have devoted little (if any) time to the assessment of writing. This is especially true in Kuwait as the author, a graduate from Kuwait University, has never taken a language testing course or received training in writing assessment.
During my time as a teacher, at the British Council of Kuwait, and the Ministry of Education, I observed that many Arab students produce overly long sentences in their written work. This, I presumed, was a subtle case of L1 transfer. Moreover, some NNS teachers were known to instruct their students not to write long sentences, as it will lead to more erroneous sentences. Even though it is established that Arabic sentences are longer on average than their English counterparts (Mohammed and Omer, 1999; Tahaineh, 2010), there is a dearth of literature analyzing the influence this has on Arab students’ writing in English. Even more scarce are studies showing the possible effect such long sentences may have on NES or NNS.
This investigation is similar in structure to a number of other investigations, namely, Connor-Linton (1995b), Johnson and Lim (2009), Kondo-Brown (2002), Lee (2009), and Shi (2001). It aims to establish how NES and Arab NNS (teachers/raters) differ in their overall severity; how they differ individually within their groups- that is, how NES differ amongst themselves and how NNS differ amongst themselves respectively; how they interact with written scripts (bias analysis), how they interact with criteria on an analytic scale (also bias analysis). The influence that sentence length had on either group of raters will also be investigated. This will be aided by qualitative data from the raters as they report reasons for their scoring behaviour. Thus, it is a mixed-methods investigation. The findings of this investigation should contribute to our understanding of: (1) rater behaviour in general, (2) the influence of raters’ language backgrounds on writing assessment, (3) the influence of sentence length on NES and NNS, and (4) the rating behaviour of Arab teachers of EFL/ESL in Kuwait during writing assessment in particular.
The following is an outline of the investigation:
• Chapter 1. Introduction.
• Chapter 2. Literature review I (Theoretical overview). This chapter will focus on the literature pertinent to the validation of writing assessment in general, and matters pertinent to rater variance in particular.
• Chapter 3. Literature review II (Research overview). This chapter will cover the various studies and investigations that have been conducted comparing the ratings of NES to NNS, as well as the issue of sentence length in English and Arabic.
• Chapter 4. Methodology. This chapter will be devoted to all the methodological issues related to this investigation, including research design, research questions, participants, instruments, procedures, data analysis, the pilot study, and ethical considerations.
• Chapter 5. Results and discussion. This chapter will cover all the quantitative and qualitative analyses and results of this investigation, along with relevant discussion.
• Chapter 6. Conclusion. This chapter will summarise the results, then discuss the limitations and implications of this investigation, along with areas of further research.
Chapter II
Literature review I (Theoretical overview).
This chapter presents a theoretical overview of literature pertinent to writing assessment in general and to raters of writing in particular. It begins by touching upon the process of validating writing assessment (section 2.1), then covers the Assessment Use Argument (section 2.2) and the importance of writing assessment (section 2.3), then sheds light on the most common form of writing assessment (the timed essay) (section 2.4). The timed essay is a form of ‘direct’ assessment, and section 2.5 differentiates between ‘direct’ and ‘indirect’ assessment with a discussion of the limitations of both types of assessment. This is followed by the rating scales, one of the key instruments in direct assessment of writing (section 2.6). A major limitation of ‘direct’ assessment (rater variation) is covered in more detail in section 2.7. Section 2.8 presents one of the most researched factors that result in rater variation (experiential factors). Finally, the issue of overcoming rater variance is covered in section 2.9. Section 2.10 summarises the chapter.
2.1 Validation of writing assessment.
Validity, traditionally defined as the extent to which a test measures what it claims to measure (Henning, 1987; Lado, 1961), is the most important concept testers in general, and language testers in particular, need to consider before administering any type of test (or assessment). The reason being that language ability/proficiency is not a quality one can observe or measure directly using a universal measurement instrument, like height or weight for example. On the contrary, language ability/proficiency is a quality in the human brain and is measured indirectly in a deductive, rather than inductive, manner. What this means is that language testers cannot directly measure the ability they wish to measure, but rather have to draw inferences about what test-takers know or can do, based on reasoning and evidence. To achieve this, they need an instrument to measure the quality (ability/ proficiency) in question. A test is the instrument most frequently used by language testers to measure language ability, and draw inferences about what test-takers know or can do. The soundness of these inferences is directly related to the soundness and strength of the evidence and reasoning provided. This should result in a confidence that the test is actually measuring the quality it purports to measure. Hence, the stronger the evidence, the more assured language testers are that their inferences about test-takers’ ability/proficiency are both true and accurate. However, the nature of deductive reasoning entails that no matter how strong the evidence, inferences made do not always follow with certainty. In other words, strong evidence and reasoning support the inference made, but not ensure it.
Language testers are primarily concerned with measuring test-takers’ ability or proficiency. In order to achieve this end, tests are usually administered with the notion that the scores of these tests would provide testers with an indication of what test-takers know or can do. Moreover, the scores are also commonly used to reach a decision such as a pass or fail, an admission or certification, etc. Some of these decisions are of great magnitude. Bachman (2004) states that when we use test scores we are “essentially reasoning from evidence, using test scores as the evidence for the inferences or interpretations and decisions we want to make” (p.275). Therefore, it is absolutely crucial for language testers to provide strong evidence that the tests they develop really do test what they claim to test, and more importantly that the scores are meaningful, fair and useful (Bachman and Palmer, 2010; Weir, 2005). So the stronger the evidence provided by language testers, the more assured we are of: (a) the inferences we make about test-takers, and (b) the decisions we make based on the test scores.
Chapelle and Voss (2014) chronologically examined all the various validation studies found in two of the most influential journals in the field of language testing (Language Testing and Language Assessment Quarterly). They observed that there were four approaches to validation; (1) one question and three validities; (2) evidence gathering, (3) test usefulness, and (4) argument-based (p.2). The ‘one question and three validities’ approach, which is largely influenced by the work of Lado (1961) and Henning (1987), begins with one basic question “Does the test measure what it claims to measure? If it does, it is valid” (Lado, 1961, p.321). This is echoed in Henning (1987) who claims that a “test is said to be valid to the extent that it measures what it is supposed to measure” (p.88). The first of the three validities referred to in the title is Content validity. This validity is rather subjective and is based on expert opinion that articulates that the test measures what it claims to measure. The second of the three validities is Concurrent and criterion-related, and is investigated by means of correlation analysis of the test in question with an external criteria or test (see section 2.1.2). The final validity is construct validity; other statistical analyses that confirm that test scores confirm the tester’s theoretical expectations (Chapelle and Voss, 2014, p.3).
The second approach to validation is ‘evidence gathering’, which has been heavily influenced by the work of Messick (1989) and, to a lesser extent, Bachman (1990), that focuses on the gathering of evidence to support the inferences made from test scores. However, Davies and Elder (2005) argue that specifying the nature of evidence and the quantity is somewhat problematic, and cannot always be simplified and transparent to test-takers (p.810).
The third approach, influenced by Bachman and Palmer (1996) is ‘test usefulness’, which is closely related to the ‘evidence gathering’ approach. This approach tried to address Davies and Elder’s (2005) criticism of the ‘evidence gathering’ approach by simplifying the process of validation and making it more transparent. The process includes investigating construct validity, test reliability, authenticity and interactiveness, impact, and practicality. The final, and latest, approach to validation is the ‘argument-based’ approach. Chapelle and Voss (2014) state that this approach is characterised by:
(1) the interpretive argument that the test developer specifies in order to identify the various components of meaning that the test score is intended to have and its uses; (2) the concepts of claims and inferences that are used as the basic building blocks in an interpretive argument; and (3) the use of the interpretive argument as a frame for gathering validity evidence. (p. 5).
This approach was influenced by the likes of Bachman (2005), Weir (2005), Kane (2006), Mislevy and Chengbin (2009), and Bachman and Palmer (2010).
Although the ‘one question, three validities’ approach can be distinguished from the other three approaches to validation, making a distinction between the other three approaches that were identified by Chapelle and Voss (2014) is not so straightforward. For example, an ‘argument-based’ approach naturally entails gathering evidence of some description. This is highlighted in the final statement of the third characteristic of the argument-based’ approach “the use of the interpretive argument as a frame for gathering validity evidence” (Chapelle and Voss, 2014, p.5). Likewise, any of the tenets of ‘test usefulness’, like reliability or impact, would also contribute to an ‘argument-based’ approach to validation. Thus, throughout this investigation, terms like ‘argument’ and ‘evidence’ will be used interchangeably.
Messick (1989), who contributed greatly to our understanding of validity, defined validity as:
“an integrated evaluative judgment of the degree to which empirical evidence and theoretical rationales support the adequacy and appropriateness of inferences and actions based on test scores or other modes of assessment” (p.13).
If we unpack Messick’s definition, we note that the term ‘validity’ is a unitary concept that encompasses and integrates any evidence that language testers may assemble to argue for the use of tests and the interpretation of test scores. It is not a quality that a test either has or lacks, but rather a matter of degree that some tests have more than others. It is provisional- that is; it may change in the future when further evidence is generated that contradicts what is known at present (see Fulcher and Davidson, 2007). Or in the words of Messick:
“validity is an evolving property and validation is a continuing process. Because evidence is always incomplete, validation is essentially a matter of making the most reasonable case to guide both current use of the test and current research to advance understanding of what test scores mean” (1989, p. 13).
There are many kinds of validity arguments made by language testers for a test which generally fall into one of two categories: the A priori validity argument, and A Posteriori validity argument (Weir, 2005). The former refers to evidence gathered before test administration and the latter to that gathered after a test. The following two sections look at each respectively, and the subsequent section covers two of the major threats to test validity.
2.1.1 A Priori validity argument.
During this phase, testers are primarily concerned with gathering validity evidence before administering the test. The first challenge faced by language testers in the field of writing assessment in this stage is specifying the writing ability they wish to measure, i.e., defining the construct (Crusan, 2010; Weigle, 2002). A construct is “an abstract concept that is defined in such a way that it can be observed, and can be measured” (Fulcher, 2010, p.319). The problem faced by testers of writing is that there is no common shared construct definition of writing ability (Crusan, 2010; Hamp-Lyons, 1991; Weigle, 2002). It is true that teachers/testers can identify scripts that contain what they believe to be ‘good writing’, but defining and describing ‘good writing’ is far more problematic (Crusan, 2014). Testers, therefore, need to clearly articulate: (1) what writing ability they wish to measure, and (2) how this ability is ‘manifested’ in the real world and how it will be tested in the assessment setting (Weigle, 2002, p.41). When testers base their writing construct on empirical evidence and theoretical rationale, then an argument could be made for the construct validity of the test (Messick, 1989; Weigle, 2002). Therefore, there is a need for assessors of writing to be aware of the prevailing theories that underlie the process of writing, and ensure that these processes are replicated as closely as possible (Weir, 2005, p.18). In other words, the tasks given to test-takers are representative of the construct testers wish to measure. (See Crusan (2010, p.13-14), Bachman and Palmer (2010), Douglas (2000), Grabe and Kaplan (1996), Hyland (2002 and 2003), and Weigle (2002) for detailed discussions of the various writing constructs).
In addition to defining the construct that is to be measured, Weir (2005) and Shaw and Weir (2007) also argue for the need to “provide empirically-based descriptions of the conditions under which these language operations are usually performed” (Weir, 2005, p.19). This type of evidence Weir refers to as ‘context validity’, which is concerned with “the extent to which the choice of task in a test is representative of the larger universe of tasks of which the test is assumed to be a sample” (ibid: p.19). In other words, the argument here is whether the content of the test (tasks and items) adequately represents the construct previously defined.
Weir (2005) categorises scoring validity- that is, “the extent to which test results are stable over time, consistent in terms of the content sampling and free from bias” (ibid: p.23), as an A Posteriori validity argument. However, it would appear that certain scoring validity evidence falls into the category of A Priori validity argument. After defining a construct (construct validity argument) and establishing the representativeness of test tasks (context validity argument), testers need to establish a scoring procedure for the test that takes the aforementioned two arguments into consideration. Typically, this involves specifying levels of performance, establishing or choosing an appropriate rating scale to score the performance, and the training of raters to understand the construct, levels of performance, and the rating scale (see sections 2.5-2.8). This, ideally, would be done before the test, not after, to contribute to the scoring validity argument. Obviously, all matters pertinent to the actual scoring of the administered test would fall into the A posteriori validity argument, which is covered in the next section.
Lack of bias (or absence of bias) is another piece of evidence that language testers need to examine in a validity argument. Bachman and Palmer (2010) define bias as “a difference in the meaning of assessment records for individuals from different identifiable groups (e.g., by gender, ethnicity, religion, native language) that is not related to the ability that is assessed” (p.129). Thus, bias contaminates the inferences testers make from test scores. Like scoring validity, an argument for the lack of bias can be made both before and after the test, though it becomes more apparent after when test scores and test-takers’ feedback are analyzed. In the a priori validity argument, testers need to ensure that the tasks do not favour one group over another or one test-taker over another. One possible source of topic bias is familiarity (or lack of). Test-takers who are more familiar with a topic are likely to produce better writing on that task than those who are not so familiar. As a result, differences in resultant scores are due to factors unrelated to language ability or the construct being measured (construct-irrelevant variance). An effort should be made during the initial stages of the test development to ensure that the test lacks bias and that following trialling, quantitative and qualitative evidence is gathered to confirm this.
Other evidence language testers need to assemble before the test involves writing unambiguous items, providing clear instructions, familiarising test-takers with the types of tasks and items they will come across, providing adequate test conditions, ensuring the test is taken in a uniform condition, identifying test-takers by number to avoid a halo effect and maximizing the security conditions of the assessment setting to avoid test-takers knowing the content before the test or cheating during the test (see Hughes, 2003). It is also good practice to trial tests before a test becomes operational. Trialling (or pilot testing) is “the process of administering pilot test materials to samples of subjects representative of the final test population, in order to gather empirical data on the effectiveness of the proposed materials, and to enable their revision” (McNamara, 2000, p.138).
Finally, it is also good language testing practice to write detailed test specifications in the initial stages of test development. Test specifications are “a detailed accounting of the test format and general test design which serves as a basis for providing information for candidates- test-takers- and test users, and for writing new versions of the test” (McNamara, 2000, p.138). This document contains details of the construct being measured, test structure, the tasks and items, scoring procedures, test conditions, intended uses of test scores and details about the test-takers, among other things.
2.1.2 A Posteriori validity argument
The process of gathering validity evidence does not stop at the point of test administration. After test administration, language testers are interested in providing further evidence for the validity of the scoring process (scoring validity), establishing the correlation of test scores with other external criteria (criterion-related validity), as well as investigating the consequences of the test (consequential validity).
Scoring validity, as mentioned previously, is the “extent to which test results are stable over time, consistent in terms of the content sampling and free from bias” (Weir, 2005, p.23). In other words, scoring validity is concerned with gathering evidence that the scores obtained on a test are consistent, error-free (for the most part), and measure the predefined construct accurately. Perhaps the biggest source of error and bias in writing assessments is the matter of rater variance. That is, variance in test scores awarded on the same written script by different raters (McNamara, 2000). Issues pertinent to rater variance will be dealt with in more detail in subsequent sections (2.7, 2.8, and 2.9). For now, it is sufficient to say that testers of language performance, i.e., writing and speaking, need to provide evidence that raters will not influence test scores and as a result contaminate the meaning, usefulness, and fairness of writing test scores. In other words, when a rater is appointed to score an essay, the choice of rater should cause no concern to the test-taker (Fulcher, 2010).
Further related to scoring validity is the argument of lack of bias. Lack of bias was mentioned in the a priori validity argument, but it generally manifests after the test (or trialling). In writing assessment there are two main sources of bias: task bias and rater bias. A task is said to have been biased if it favoured one group of test-takers over another resulting in scores that are unrelated to the construct being measured. This can be detected via statistical analyses after the test. Comparisons of group performances using t tests (or the non-parametric Mann-Whitney U test), and various forms of Analysis of Variance (ANOVA) are usually run to detect any significant group differences after the test (Green, 2013). Qualitative data in the form of test-taker feedback can also be analysed and inspected for bias. Moreover, in writing assessment it is common for test-takers to have a choice from a number of topics. After the test, it may become apparent that one topic (or task) was significantly more difficult than the other. In this case, testers need to take this into consideration when reporting the scores (Eckes, 2011). This is usually made possible by way of Multi-Faceted Rasch Analysis (MFRM), which will be discussed in section 2.8.2.
Another source of bias in writing assessment is the rater. After test-takers complete the writing task, raters are required to use their expert judgment to assign a score to that writing. Usually, this is done by means of a rating scale, where raters try to match test-takers’ performance with the appropriate descriptor level of the scale that best describes the performance (Van Moere, 2014). This brings an element of subjectivity to the rating process that must be taken into account. Raters may overestimate (give a score higher than expected) or underestimate (give a lower score than expected) written scripts due to features other than the construct being measured. There are numerous ways in which raters may differ, most of which will be covered in sections 2.6, 2.7 and 2.8. Suffice to say, testers need to provide sound evidence that test-takers’ scores are not influenced by raters or raters’ biases. This, in my opinion, is the hardest argument that testers have to make for the validity of the scores of performance-based language tests (i.e., writing and speaking). Another dimension of a posteriori validity argument is criterion-related (Messick, 1989; Shaw and Weir, 2007; Weir, 2005). Criterion-related validity arguments are, by and large, quantitative in nature and assemble evidence beyond the actual test. Weir (2005) describes it as evidence “concerned with the extent to which scores correlate with a suitable external criterion of
performance.. with established properties” (p.35).
This form of validity may be broken down into two types: concurrent validity and predictive validity. Bachman (1990) defines the former as a validity argument that looks for “a criterion which we believe is also an indicator of the ability being tested” (p.248), against which to measure the test scores. For example, correlating test scores with teachers’ formative evaluations and rank order of students (Alderson et al., 1995). Bachman (1990) and Bachman and Palmer (2010) highlight the problem with such correlations. They argue that the criteria to which the scores are to be correlated may not be a valid measure of the construct itself. Thus, high correlations do not equate to either test being a valid measure of the construct. The other type of concurrent validity is predictive validity. That is, “the correlation between test scores and later performances on something, such as overall academic success” (Carr, 2010, p.325). Like concurrent validity, this validity is also problematic for practical reasons. Correlating test scores with future potential job performance, for example, is just not possible. And even if it were, there are too many confounding intervening variables for the correlations to hold any meaning (Weir, 2005). Success in future jobs is not dependent solely on language ability but rather on other factors like motivation, dedication, social and emotional intelligence, etc., and thus high correlations are not very meaningful.
A further dimension of the A posteriori validity argument is pertinent to the consequences of the test, and in particular the test scores. Messick (1989) was one of the first to articulate the notion of consequential validity. He argued for the investigation of the intended and unintended consequences any given test may have on test-takers, stakeholders, and society in general. Consequential validity encompasses the notions of washback (or backwash) and impact. Washback simply refers to the effect or influence a test may have on teaching behaviour that precedes the test (Bachman, 1990; Fulcher and Davidson, 2007). It is common to refer to washback as either positive or negative (Bachman, 1990; Bachman and Palmer, 2010, Brown, 2005), but others have proposed a less evaluative term of intended or unintended washback (Green, 2008; see also Weir, 2005). The term impact is slightly broader and is used to “denote the effect of the use of a test on society, institutions, stakeholders, and individual test takers” (Fulcher and Davidson, 2007, p.372). Thus, consequential validity encompasses impact and washback. Testers need to provide evidence that the test had its intended (positive) washback and impact.
The main types of validity arguments covered in sections 2.1.1 and 2.1.2 are presented in figure 2.1. This figure is adapted from the work of Shaw and Weir (2007) and Bachman and Palmer (2010). The subsequent section covers two major threats to validity (Messick, 1989).
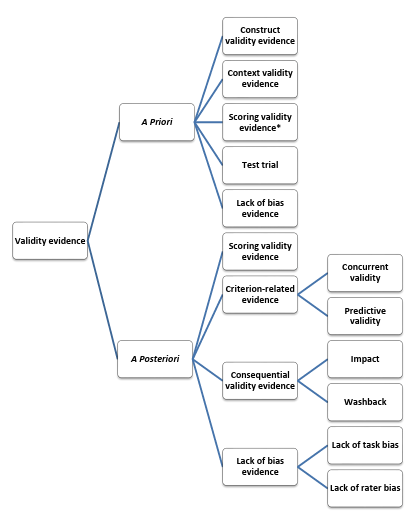

*In Weir’s (2005) framework this form of validity is a posteriori only.
Figure 2.1 Confounding types of evidence with aspects of validity
2.1.3 Major threats to validity.
When making an argument for the validity of a writing test, language testers need to consider two major threats to validity: construct-underrepresentation and construct-irrelevant variance (Messick, 1989 and 1994; Weir, 2005). The term Construct-underrepresentation refers to the “extent to which a test does not measure the relevant constructs is the degree to which it under-represents the constructs that are generally required” (Fulcher, 2010, p.320). In the field of writing assessment, this usually occurs when inferences are made about test-takers’ writing ability from an insufficient number of performances. It can also occur when important constructs are under-represented (if represented at all) in the test. This, Weir (2005) states, would have a negative and unfavourable wash back effect- that is: “the effect of a test on teaching and learning, including effects on all aspects of the curriculum, including materials and teaching approaches, as well as on what the students do to learn and to prepare for tests” (Carr, 2010, p.332). Construct-irrelevant variance, on the other hand, refers to “any changes in a score for reasons unrelated to the construct” (Fulcher, 2010, p.320). Variance in test scores should be pertinent to test-takers’ ability on the construct being measured. However, in many cases variance in test scores are due to other factors such as test methods, vague instructions, test-takers’ characteristics, inconsistent test administrating, test familiarity, etc. (Hughes, 2003; Shaw and Weir, 2007). As mentioned in the previous section, a test is also said to be biased if certain test-takers perform better (or worse) than others due to factors unrelated to the construct being measured (Bachman and Palmer, 2010, p.129). Naturally, if testers can make an argument for the lack of the aforementioned two threats, then that would constitute a validity argument. The ultimate goal is to have tests that are both construct-representative and construct relevant.
As mentioned in the previous section, in most writing tests, test-takers are required to produce a written performance (constructed response) which is subsequently awarded a score by a human rater. This brings an element of subjectivity to the assessment setting. Different raters may award different scores on the same performance, i.e. rater variation. Moreover, the same raters may award the same performance a different score if they were to rate it on more than one occasion. The issue of rater variance is of major concern to language testers and one of the main sources of construct irrelevant variance in writing assessment (Weigle, 2002). Thus, language testers need to analyse in great detail the extent to which raters vary and adequately account for this variation when reporting test scores. Failure to do so would result in false/inaccurate inferences being made on test-takers’ writing ability and the ensuing decisions based on their scores, unfair. In my opinion the most practical way to guide the overall process of language test development and validation is by constructing an Assessment Use Argument (AUA) (cited in Bachman and Palmer, 2010; see also Bachman, 2005; Chapelle and Voss, 2014) that articulates all the issues stated in sub sections 2.1.1, 2.1.2 and 2.1.3 in great detail, and justify to stakeholders the use of a test and the decisions testers make based on test scores.
2.2 Assessment Use Argument (AUA).
In accordance with Messick’s (1989) definition of validity (see section 2.1), an Assessment Use Argument (AUA) is a set of explicitly stated procedures that guides the process of language test development and provides a rationale and justification for the use of an assessment backed by evidence (Bachman and Palmer, 2010). At the heart of the process is accountability, or assessment justification – that is, the necessity for testers to justify the use of an assessment and provide sufficient evidence of the validity of the interpretations and use(s) of test scores to stakeholders. According to Bachman and Palmer, an AUA consists of:
A set of claims that specify the conceptual links between a test taker’s performance on an assessment, an assessment record, which is the score or qualitative description we obtain from the assessment, an interpretation about the ability we want to assess, the decisions that are to be made, and the consequences of using the assessment and of the decisions that are made (2010, p.30).
There are essentially four claims in an AUA that will all be briefly covered in the subsequent sub sections:
2.2.1 Claim 1: The consequences of using the assessment and of the decisions that are made are beneficial to stakeholders (Bachman and Palmer, 2010, p.177-192).
Testers in this claim articulate the intended beneficial consequences of using an assessment to the various stakeholders- that is, individuals who are most likely to be affected by the use of an assessment (e.g., test-takers, teachers/instructors, parents, program directors, etc.). Some of the warrants that may be articulated include the specific intended benefits of the assessment on each stakeholder group, the confidentiality of test-takers’ assessment reports, clarity of assessment reports to all stakeholder groups, the distribution of the reports in a timely manner, and how the use of an assessment will promote improved instructional practice (teaching).
2.2.2 Claim 2: The decisions that are made on the basis of the interpretations: (a) take into consideration existing societal values and relevant laws, rules and regulations; and (b) are equitable for those stakeholders who are affected by the decision(s) (Bachman and Palmer, 2010, p.193-207).
In this claim, testers justify the decisions (or classifications) that are made based on test scores. These decisions can be selection, certification, placement, instruction, etc. Such decisions should be made in light of societal values and careful consideration of legal requirements. Moreover, the societal values and laws and regulations should be taken into consideration when analysing and dealing with classification errors (e.g., passing a test-taker who deserves to fail and vice versa). Moreover, test-takers (and stakeholders) should not be in the dark about the decisions to be made and how they are made. They should also have equal opportunities to practise the ability testers wish to assess.
2.2.3 Claim 3: The interpretations about the ability to be assessed are: (a) meaningful; (b) impartial; (c) generalizable; (d) relevant; and (f) sufficient (Bachman and Palmer, 2010, p.209-240).
Test scores are used to infer something about test-takers’ ability. These inferences (interpretations) need to be meaningful. That is, (a) test scores are based on a clear, predetermined construct definition which in turn is based on a needs analysis, course syllabus or a linguistic theory; (b) the conditions that test-takers will perform the test under are clearly articulated; (c) the conditions and settings elicit the best possible test-taker performance (commonly referred to as bias for best, Bachman and Palmer, 2010); (d) test-takers’ performance is directly related to the construct being measured; and (e) test tasks engage the construct being measured. Moreover, the test itself should be impartial; the tasks and setting does not favour any test-takers in any way other than the construct being measured. The scores should also be generalizable. That is, tasks and test-takers’ responses should correspond to a target language use domain. In addition, the inferences that are made based on performance on the test should be relevant to the decisions testers wish to make. Finally, the inferences made should also be sufficient for the decisions testers wish to make.
2.2.4 Claim 4: Assessment records (scores, descriptions) are consistent across different assessment tasks, different aspects of the assessment procedure, and across different groups of test-takers (Bachman and Palmer, 2010, p.242-246).
Warrants and justifications in this claim pertain to the quality and consistency of the test scores (assessment records) and the procedures taken to ensure it. Testers in this claim articulate warrants about the: (a) reliability of the test (test-retest reliability, internal consistency of items/tasks, equivalent reliability of different forms of the test); (b) consistency of administration; and (c) adherence to the specified test procedures. In rater-mediated assessments, this claim will include further warrants pertinent to the quality of rater judgments. Humans bring an element of subjectivity, bias and fallibility to the assessment setting in performance-based language assessment
which contributes to rater variance (McNamara, 1996).
This could be articulated as an argument against Claim 4 of the AUA. As a rebuttal to this argument Bachman and Palmer suggest that the Claim 4 of the AUA includes: (I) evidence of rater training and certification; (II) training raters to avoid biases; (III) evidence that different raters award consistent scores to the same performance (inter-rater reliability); and (IV) evidence that the same rater awards consistent scores to the same performance when rated another time (intra-rater reliability). However, these warrants alone do not provide enough backing for the quality of scores in rater-mediated assessments. It is possible that highly consistent ratings (inter-rater and intra-rater reliability) are misleading and lack quality. Moreover, rater training and certification per se does not ensure quality ratings in rater-mediated assessment, nor has it been shown to overcome rater biases (see section 2.9.1). Thus, variance in scores (rater variance) could muddy the meaningfulness and fairness of test scores.
Rater variance in scoring writing tests is the main focus of this investigation and issues pertinent to rater variance and how to tackle them will be covered in subsequent sections (2.6, 2.7, and 2.8). It was noted in previous sections that the rater variance can muddy a number of interrelated validity arguments (scoring validity, lack of bias, and construct-relevance), and Claim 4 of the AUA. Primarily, however, language testers need to make a case for why writing ability should be tested in the first place. The next section covers the importance of writing assessment.
2.3 The importance of writing assessment.
The first thing testers need to do in the initial stages of constructing an AUA is to determine whether as assessment is really needed (Bachman and Palmer, 2010). Pertinent to this investigation, testers should ask whether writing ability is something that needs to be assessed. If so the question then shifts to how we should assess this ability.
Crystal (1997) states that the majority of “the scientific, technological, and academic information in the world is expressed in English and over 80% of all the information stored in electronic retrieval systems in English” (p.106). English is also the main language of the internet, which further emphasises the language’s importance (Gebril and Hozayin, 2014). This outcome of this is an increase in the number of English language learners who need to display a certain degree of proficiency in English for educational and/or employment purposes (Crusan, 2014). Numerous decisions are made in educational programs for purposes of “screening, admissions, placement, scholarship selection, and program exit” on the basis of students’ language proficiency (Gebril and Hozayin, 2014, p.3).
One of the main measures of language proficiency, used in virtually every educational institute and in nearly every placement test, proficiency test, achievement test, etc., is the ability to write. It is a requirement of all universities in the United Kingdom (UK), United States (US), Canada and Australia that international students demonstrate their English language proficiency by achieving a certain score on a standardized, international proficiency test, i.e. the Test of English as a Foreign Language (TOFEL) or the International English Language Test (IELTS). The majority of the aforementioned tests consist of a writing section that makes up for at least one quarter of the overall score. Bjork and Raisanen (1997) highlight the “importance of writing in all university curricula not only because of its immediate practical application, i.e. as an isolated skill or ability, but because we believe that, seen from a broader perspective, writing is a thinking tool”. They argue that writing is “a tool for language development, for critical thinking and, by extension, for learning in all disciplines” (p.8). Similar to universities in the UK, US, Canada and Australia, most higher education institutes in Arab countries in general, and Kuwait in particular, demand that students demonstrate their proficiency in English. For example, successful acceptance into many departments in Kuwait University and the Public Authority for Applied Education and Training (PAAET) in Kuwait, require students to display their proficiency either via the TOFEL/IELTS, or an in-house English proficiency test. Moreover, it is not uncommon for students to continue to take further courses in English for specific purposes (ESP) or English for academic purposes (EAP) throughout their academic career as part of their curriculum. In addition, Gebril and Hozayin (2014) also state that it is customary for employees to demonstrate their English proficiency in many business settings, especially banking, tourism and the oil sectors in the Arab region (p.6).
Writing is one of the most essential skills students need in their academic lives in most educational institutes in the Arab world (Tahaineh, 2010). Moreover, writing in English is one of the fundamental aims of teaching English in these institutions as it is, generally, the medium of instruction (Al Khuwaileh and Shoumali, 2000). Consequently, for the sake of validity, this skill must be measured fairly, consistently and accurately. Even though there are contexts where writing is assessed formatively- that is “assessment procedures to inform learning and teaching, rather than assess achievement, or award certificates” (Fulcher, 2010, p.321), the majority of writing assessments in most academic institutes around the globe are summative- that is assessment “at the end of a programme of study to measure achievement or proficiency, often with the intention of certification” (Fulcher, 2010, p.323). This is also the case in the Arab countries. Gebril and Hozayin (2014), for example, state that even “formative assessment places huge emphasis on preparing students for these end-of-year examinations instead of providing students with opportunities to reinforce their learning” (p.6). Furthermore, Haddadin et al., (2008) found that Arab students (Jordanian) were interested merely in learning whatever skills they were going to be tested on at the end of the year. This illustrates a clear example of test washback.
Timed essay achievement tests are the most common form of summative tests used in academic settings (Crusan, 2010; Weigle, 2002). Furthermore, with the exception of very few cases, the vast majority of these tests are criterion referenced; “Interpreting test scores in relation to ‘absolute’ performance criteria, rather than in relation to other scores on a scale” (Fulcher, 2010, p.320). Therefore, the majority of students need to demonstrate their writing proficiency through timed essays to successfully gain entry into academic institutes or pass academic courses in most Arab countries (Ahmed, 2011). The next section will cover ‘timed essays’.
2.4 Timed Essay assessment.
The timed essay, also known as the timed impromptu writing test or the one-shot essay, is a test in which students are required to produce an extended piece of writing in response to a set of instructions (prompt) in no less than 100 words (Hamp-Lyons, 1991, p.5). This task is completed within a specified time limit, 30-120 minutes for example, and is awarded a score upon completion by a rater using a rating scale (Weigle, 2002, p.58-9). This is the most commonly used form of writing assessment in most language testing and academic settings (Crusan, 2010; Hyland, 2003; Weigle, 2002). Even though there is a strong call for alternative forms of writing assessment, like portfolio assessment (see following paragraph), nearly all international proficiency tests, e.g., TOFEL, IELTS, and a large number of academic courses in various educational institutes, continue to assess writing ability using the timed essay. The situation in Kuwait is no exception; writing ability in schools, colleges and universities, along with other private educational institutes, is assessed mainly through the timed essay. It follows, therefore, that if this is the method used to assess students’ writing, then this is the way that writing will be taught. This is what language testers refer to as ‘washback’; “The effect of a test on the teaching and learning leading up to it” (McNamara, 2000, p.138).
Criticism found in the literature towards this type of assessment generally falls under two categories: (a) the emphasis this type of assessment places on the written product, as opposed to the process; and (b) the usefulness of scores in this form of assessment. The remainder of this section will discuss the former whereas the next section will shed light on the latter. Timed essays are product-oriented forms of writing where the emphasis is on the final written product. It is argued that this form of assessment does not take into account the fact that writing is a recursive process that involves a number of important stages like planning, drafting, revising and
editing (Weigle, 2002, p.197). Unlike the product-oriented form, the process-oriented form of writing does take these stages into account. Consequently, portfolio assessment is the main method of choice for process-oriented writing (Crusan, 2010). Portfolio assessment “requires a test taker to undertake a variety of tasks, the outcome of which are assembled into a compendium of work that demonstrates the range and depth of learning” (Fulcher, 2010, p.322; see also Weigle, 2002, p.197 229). This form of assessment mirrors the natural writing process by: (1) overcoming the limitation of over-generalizing the scores of a single writing assessment; (2) producing written work in a more natural setting as opposed to artificial test conditions; and (3) documents the processes of drafting and revising (Crusan 2010, p.79). Despite these advantages, the product-oriented form of assessment, i.e. the timed essay, still dominates the academic scene (Crusan, 2010; Hyland, 2003; Weigle, 2002).
Criticism pertaining to the usefulness of product-oriented assessment is part of a much broader historical debate in the field of language testing; ‘direct’ vs ‘indirect’ assessment of writing ability. The timed essay is a form of ‘direct’ writing assessment. The distinction between ‘direct’ and ‘indirect’ assessment will be covered in the next section (section 2.5) along with a critique of both types of assessment. Matters pertinent to rating scales in ‘direct’ assessment will be covered in section 2.6. One of the main issues pertinent to ‘direct’ assessment (rater variance), will then be discussed in section 2.7.
2.5 ‘Direct’ and ‘indirect’ writing assessment.
There are, in broad terms, two main methods used to assess writing: indirect assessment and direct assessment, and to better understand the complexities and problems pertinent to timed essays, it is essential to differentiate between the two. However, it is worth first noting that the terms ‘direct’ and ‘indirect’ are used rather loosely here. As stated in section 2.1, language ability/proficiency is not something that can be observed or measured directly, and thus every test is ‘indirect’ by default. Therefore, the terms ‘direct’ and ‘indirect’ are used more in relation to test methods in this section. With ‘Indirect’ writing assessment, aspects of receptive micro-linguistic writing skills, like grammar, punctuation, spelling and organization are assessed separately (McNamara, 2000). This is done using related tasks such as multiple choice questions, cloze tests, error recognition, or gap filling questions (Hyland, 2003, p.8-9). Indirect assessment does not require candidates to “demonstrate the skill being assessed in observable performance” (Fulcher and Davidson, 2007, p.371). In contrast, ‘direct’ assessment, it has been claimed, “directly observes the construct we wish to test” (Fulcher and Davidson, 2007, p.371). Thus, if we wanted to measure someone’s writing ability, we ask them to write (Hughes, 2003). This can be done by using the timed essay method (see previous section), or by portfolio assessment among others. Figure 2.2 demonstrates the difference between ‘direct’ and ‘indirect’ writing assessment, and gives examples of the types of writing tests that are used when the product or process is emphasized (see previous section for distinction between ‘product’ and ‘process’).

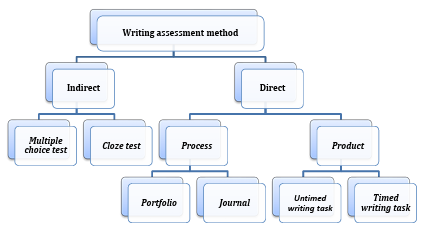
The complexity of testing writing ability using the ‘direct’ method is due to the subjective nature of the scoring process (McNamara, 2000). Fallible human raters are required to judge a written script and award a score which can easily be influenced by their personal feelings, beliefs, preferences, perceptions, along with their backgrounds, experience, pedagogical values etc. (Crusan, 2010; Van Moere, 2014; Weigle, 2002). Fulcher (2010) articulates this complexity well by stating that ‘there is an assumption that whichever rater is making the judgment should be a matter of indifference to the test taker. What this means in practice is that if I produce an extended written response to a writing prompt, I should get the same score irrespective of who rates the writing sample. That is, if there is variation by rater this is considered to be a source of unreliability, or error’ (p.52-53). Unfortunately, the harsh truth of the matter is that the literature shows that there are a number of interfering variables that influence raters when scoring written scripts (McNamara, 1996 and 2000; Van Moere, 2014). These include the rating scale used in the assessment, time and place of assessment, teaching and rating experience, plus a host of other variables which can all influence raters’ judgment (Van Moere, 2014; see next section for more details). Hence, scores of writing tests could reflect some aspects of the raters; when/where/how they rated the script in the same way as they reflect writing ability and thus, scores are significantly due to chance (McNamara, 2000, p.37). These differences are obviously problematic, especially when the test results are of high importance – that is, tests “which provide information on the basis of which significant decisions are made about candidates, e.g. admission to courses of study, or to work settings” (McNamara, 2000, p.133).
These concerns are by no means new to the literature. Edgeworth (1890), for example, articulated some of these concerns over 120 years ago by stating that ‘the element of chance in these public examinations to be such that only a fraction- from a third to two thirds- of the successful candidates can be regarded as safe, above the danger of coming out unsuccessfully if a different set of equally competent judges had happened to be appointed’ (cited in Weir, 2013, p.144). The seminal work of a research team lead by Paul Deiderich (1961) supported Edgeworth’s aforementioned claim by observing that raters’ scores on the Scholastic Assessment Test (SAT) writing test were not very reliable (Deiderich et al., 1961). Hamp-Lyons (2007) argues that today we may understand all the limitations and shortcomings of Deiderich, but the results were, nonetheless, highly significant and very influential at that time.
For the reasons mentioned above, it is easy to see why many language testers and professional testing institutes, especially in the US, e.g., the Educational Testing Service (ETS), shifted from using ‘direct’ tests of writing to ‘indirect’ tests from 1940 onwards (Hymp-Lyons, 1990; McNamara, 2000; Weir, 2013). For example, the Test of English as a Foreign Language (TOFEL), which was first administered in 1964, tested writing ability via ‘indirect’ tests for over 20 years (Yancey, 1999, cited in Weir, 2013). It had been statistically proven that ‘indirect’ tests correlate with the ability to produce proficient writing (De Mauro, 1992, cited in Weir, 2013) and were thus deemed more suitable than the ‘direct’ method. Crusan (2014) summarizes the appeal of ‘indirect’ tests of writing by stating that “it is difficult to resist the promise of reliable and valid writing assessment for a fraction of the time, money and energy” (p.6).
Although the majority of testers in the US preferred ‘indirect’ tests to ‘direct’ tests of writing for the reasons mentioned earlier, a number of testers across the Atlantic in the United Kingdom (UK) felt that the overall validity of writing assessment was being sacrificed for its reliability (described hereinafter as scorer validity). Educators in the UK, for example Wiseman (1949), Wiseman and Wrigley (1958), and Britton et al. (1975) (cited in Hamp-Lyons, 1990, p.69), warned of the limitations and dangers of ‘indirect’ testing, and carried out research to improve scorer validity in ‘direct’ assessment. Their work later yielded models for ‘direct’ writing assessment in the US. Thus, even though educators in the UK were fully aware of the limitations of ‘direct’ assessment, testing agencies in the UK, e.g., IELTS, nonetheless felt it was necessary to continue to use the ‘direct’ method (Shaw and Weir, 2007; Weir, 2013).
The popularity of ‘Indirect’ tests of writing, though, diminished as they failed to directly tell testers what test-takers can/cannot do as writers (Hamp-Lyons, 1990; McNamara, 2000; Shaw and Weir, 2007), and they “seriously under-represent writing skills” (Weir, 2013, p.180). Plus, having a high score on a grammar or vocabulary test does not necessarily guarantee that the candidate is a good writer (Crusan, 2014; Hyland, 2003). These tests also lacked face validity, that is, they do not seemingly appear to test what they claim to test (Crusan, 2014, p.6). Thus, if the aim is to measure writing proficiency then a test should look like a writing test rather than a grammar or vocabulary test. Additionally, indirect testing can have a negative impact on the process of learning to write. Since the concept of validity was expanded by Messick (1989) to encompass the consequences of a test (consequential validity: “the effect that the use of a test has on test-takers, teachers, institutions and society at large” (Fulcher, 2010, p.319)), concerns have grown that these types of tests encourage test-takers and teachers to spend more time practicing test-taking strategies and techniques rather than the target language skills (Alderson and Hamp-Lyons, 1996; Crusan, 2014; Messick, 1989). (See Shaw and Weir (2007, p.218-28) for a comprehensive treatment of
consequential validity in writing assessment). Learning these test-taking strategies, as opposed to learning actual language skills, is referred to as unintended, or negative washback in language testing jargon (Crusan, 2014), which could result in some construct-irrelevant variance- that is, “differences in the performance of candidates on a test which are unrelated to the ability or skill being measured” (McNamara, 2000, p.132). On the other hand, it is argued that ‘direct’ assessment encourages students to engage in real writing and practice the skill more frequently since they will be assessed on their ability to produce a full piece of written discourse (McNamara, 2000). For a further discussion of the disadvantages of ‘indirect’ writing assessment, see Hamp-Lyons (2001, p.3), White (1995, p.34), Weir (2013).
These limitations, along with immense social pressure from educational institutes (schools, colleges, universities) and stakeholders (students, parents, teachers), who felt this type of testing (indirect) was resulting in a decline of literacy levels (Hymp-Lyons, 1990), led testers in the U.S. to reconsider ‘direct’ tests of writing and ultimately replace ‘indirect’ tests with ‘direct’ ones. For example, in 1986, ETS introduced the Test of Written English (TWE), which was a ‘direct’ test of writing to be taken optionally with the TOFEL (Hamp-Lyons, 1990). This incident is described by Hamp-Lyons (1990, p.70) as the “final nail in the coffin of indirect measurement”. She went on to boldly claim that ‘indirect’ assessment has not “only been defeated but also chased from the battlefield” (1990, p.69). Nevertheless, 25 years after Hamp-Lyons made this claim, ‘indirect’ tests of writing still have their place in many academic institutions. Many schools and community colleges, especially in placement tests, still opt for ‘indirect’ writing tests (Crusan, 2010, Hout, 1994). In fact, Hout estimates that approximately 75% of educational institutes (in the US) still assess writing ‘indirectly’ for placement purposes (cited in Crusan, 2010, p. 108). In addition, in 2002 Crusan noted that “at least three of the largest most prestigious Universities” in the US still place students in ESL writing composition classes based on their scores on an ‘indirect’ multiple choice test (Crusan, 2002, p.25). This, Crusan (2010) argues, is indicative of the importance test administrators place on practicality (time, cost and convenience). Providing human raters to score written work, training them, monitoring them, etc., is a tedious and costly task (Montee and Malone, 2014; Van Moere, 2014).
Practical reasons aside, the main limitation of ‘direct’ assessment amongst language testers has always centred on scorer validity. The issue of rater variability is what led many testers to favour ‘indirect’ assessment over ‘direct’. ‘Direct’ assessment of writing may be a ‘better’ form of assessment than ‘indirect’, according to many, but it is far from a perfect form of assessment. Language testers must still deal with the issue of rater variability if they are to continue to measure students’ writing ability in a fair and accurate manner. The ways in which raters vary need to be recognized in order to overcome or limit this variation (McNamara, 2000; Weigle; 2002; Hymp-Lyons, 1990, 1991) to ensure test-takers get fairer and more consistent results. The factors that result in rater variations need to be identified, controlled and if possible, reduced (Van Moere, 2014; Shaw and Weir, 2007).
To sum up, a large number of professional testers and testing agencies, especially in the U.S., believed that: (1) ‘indirect’ tests were more practical (less time-consuming), easier to administer, and easier to score, (2) they would provide testers with an accurate enough and, more importantly, objective estimate of the test-takers’ overall writing ability (Carr, 2011; Hyland, 2002), and (3) that ‘direct’ tests were useless since raters’ evaluations were very subjective and may greatly vary (Hamp-Lyons, 1990, 1991; McNamara, 2000). A summary of the main differences between ‘direct’ and ‘indirect’ assessment is presented in table 2.1.

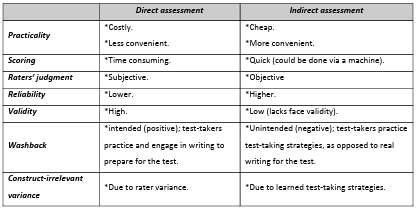
One of the main ways to improve scoring validity in ‘direct’ assessments of writing is the use of rating scales. Scales are said to make rating language performance less subjective and result in lower rater variance (Montee and Malone, 2014; Van Moere, 2014). Weigle (2002) states that scores awarded to written scripts in ‘direct’ assessment are “the outcome of an interaction that involves not merely the test-taker and the test, but the test-taker, the prompt or task, the written text itself, the rater(s) and the rating scale” (p.108). Thus it is important to shed light on rating scales in ‘direct’ assessment.
2.6 Rating scales in ‘direct’ assessment.
In most cases of writing assessment, rating scales are used when scoring written work (Montee and Malone, 2014). A rating scale is defined as:
“A scale for the description of language proficiency consisting of a series of constructed levels against which a language learner’s performance is judged… (it) provides an operational definition of a linguistic construct such as proficiency. Typically such scales range from zero mastery through to an end-point representing the well-educated native speaker. The levels or bands are commonly characterised in terms of what subjects (test-takers) can do with language… and their mastery of linguistic features” (Davies et al., 1999, p.153).
Thus, it is an instrument that raters use to evaluate the quality of writing more objectively and consistently using a specific set of criteria as descriptors, as opposed to basic intuitive scoring (Crusan, 2014; Fulcher, 2010; Weigle, 2002). A descriptor is “a prose description of a level of performance on a scale” (Fulcher, 2010, p.320). So a rating scale is an ordered series of descriptors, usually between 3 and 9, that guides raters during the rating process (McNamara, 2000, p.40-1). There are three main types of rating scales that are used when assessing writing: primary trait scales, holistic scales, and analytic scales (Montee and Malone, 2014; Ferris and Hedgcock, 2014; Weigle, 2002). Primary trait scales are scales that are “used to assign a single score based on one trait of the performance” in relation to a specific task (Montee and Malone, 2014, p.5; Weigle, 2002). For example, a scale is developed for raters to award a single score to one aspect of performance they feel is most important in the given task, like persuasiveness in an argumentative essay. Thus, each task has its own primary trait scale (Weigle, 2002). This approach to scoring written work is extremely time-consuming (Montee and Malone, 2014; Weigle, 2002) and the scores cannot be generalized (Shaw and Weir, 2007). In addition, Weigle believes that this type of scale has not been widely used in second language (L2) writing assessment, and that there is a dearth of literature on how this may be implemented in L2 writing assessment (p.110). For these reasons, holistic and analytic scales are the more popular scales used when scoring writing (Monte and Malone, 2014).
Holistic scales, also known as global scales, allow raters to assign a single score to the written performance as a whole (Ferris and Hedgcock, 2014; McNamara, 2000). White (1985) argues that this type of scale allows “quick, economical, and reasonably reliable rankings” of a large number of written samples (p.31). He also argues that this type of scale focuses on the strengths of a written script, rather than the deficiencies. As a result, test-takers are rewarded for what they did well (Weigle, 2002). However, this type of scale also has its disadvantages. A single score: (1) does not provide adequate diagnostic feedback to students (Ferris and Hedgcock, 2014; Montee and Malone, 2014); (2) is difficult for stakeholders to interpret (Bachman and Palmer, 2010; Ferris and Hedgcock, 2014); and (3) does not take into consideration that students’ proficiency in the various sub-skills of writing vary, that is, students may have different proficiency levels in different criteria (Bachman and Palmer, 2010; McNamara, 2000; Weir, 2005). Weigle (2002) and Weir (2005) state that writers, especially L2 writers, develop different writing skills at different rates. Though the practicality of these scales makes them popular in many assessment settings (Montee and Malone, 2014), analytic scales are far more suited for writers in general and L2 writers in particular (Bachman and Palmer, 2010; Weigle, 2002; Weir, 2005).
Analytic scales allow raters to assign a separate score to various aspects of performance such as coherence, cohesion, vocabulary and grammar, etc., rather than a single overall score (Ferris and Hedgcock, 2014; Montee and Malone, 2014). This type of rating scale provides more specific information to stakeholders (test-takers, teachers, administrators, etc.) about the test taker’s ability,
and is more suitable in high stakes assessment settings (Montee and Malone, 2014; Weigle, 2002). Moreover, because each writing skill is scored separately, this type of scale overcomes the limitations of holistic scales which do not take into consideration various proficiency levels within a single performance (Ferris and Hedgcock, 2014; Hamp-Lyons, 1991; Weir, 2005). Thus, it is more suitable for the assessment of L2 writers, who demonstrate a “marked or uneven profile across different aspects of writing” (Weigle, 2002, p.120). This type of scale is also said to be more reliable than holistic scales (Ferris and Hedgcock, 2014; Hamp-Lyons, 1991; Van Moere, 2014; Weigle, 2002).
Inexperienced raters, furthermore, find this scale easier to use than holistic scales (Weigle, 2002;
Weir, 1990).
Analytic scales do, however, have a number of limitations. They are much more time-consuming since raters are required to attend to numerous features of writing (Montee and Malone, 2014). Moreover, it is argued that some experienced raters display a halo effect when using the analytic scale; they form an overall (holistic) impression of the written script and then score every feature of the analytic scale in accordance with their overall (holistic) impression (Weigle, 2002; Weir, 2005). Unlike holistic scoring, it is argued that analytic scoring is not a natural process; readers do not naturally read a script while paying attention to particular features of the writing (White, 1995). Another limitation is that these scales may influence raters when scoring scripts that exhibit more clearly the features (criteria) of the analytic scale (Ferris and Hedgcock, 2014, p.212). Thus, if a written script exhibits bad grammar, raters may show bias in scoring other features of the analytic scale. This is related to the ‘halo effect’ that Weigle (2002) mentioned when raters used the analytic scale (see section 2.8.1).
A summary of the differences between holistic and analytic scoring, adapted from Weigle (2002, p.121), is presented in table 2.2. For further discussion, see Harsch and Martin (2013) and Knoch (2009).

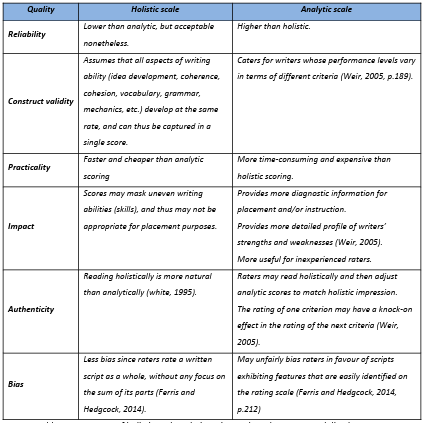
Even though rating scales, especially analytic scales, can improve scoring validity, McNamara (1996 and 2000) argues that raters can still differ in their interpretation of the descriptors on the rating scale. These differences between raters result in rater variation. The next section (2.7) covers rater variance in ‘direct’ assessment and sheds light on how raters may vary despite using the same rating scale to score the same script.
2.7 Rater variance in ‘direct’ assessment.
One of the major concerns of language test constructers when assessing writing ability using ‘direct’ assessment is scoring validity in general and rater variation in particular. Scoring validity covers all the aspects that may hinder test scores’ overall validity throughout the rating process, such as rating criteria, rating procedure, rating conditions, rater training, post-exam adjustments, and grading and awarding (Weir, 2005, p.47). Rater variation, on the other hand, is the variance in scores awarded by raters on the same script, using the same rating scale (McNamara, 2000). There are a number of factors and variables, other than test-takers’ language performance, that may influence the scores that raters award. The influence these factors have on test scores is a matter of great concern to language testers (Eckes, 2011; McNamara, 1996; Lumley, 2005; Vaughan, 1991; Weigle, 2002).
Described as the potential “Achilles heel of performance testing”, (O’Sullivan and Rignal, 2007, p.47), rater variance is a significant source of construct-irrelevant variance. In a writing assessment scenario therefore, a test candidate’s score may be due not only to the candidate’s writing ability, but also to the rater scoring the script. Another rater, in theory, could very well assign a completely different score to the same written script. This is a threat to scorer validity. McNamara (1996, p.123 5; and 2000, p.98-100) and Myford and Wolfe (2003 and 2004) highlight a number of ways in which raters may systematically differ (rater effects):
• Raters may not be self-consistent. The same rater may award a different score to the same script when scored more than once in a different context (e.g., time of day, order of compositions, single or group rating, location), different physical or emotional state, or even his/her expectation of the script (see also McNamara, 2000, p.38; Weigle, 2002, p.72-5). Myford and Wolfe (2003) refer to this phenomenon as ‘randomness’.
• Raters may differ in their overall severity when scoring (severity effect). One rater may consistently award higher marks than another rater on all scripts.
• Raters may differ in their interaction to a specific item or type of candidate (bias effect). They may be consistently more lenient to one type of item/candidate(s) and harsh on another type of item/candidate(s). For instance, they may consistently score one type of writing task, i.e., argumentative essays, more harshly than other types of tasks. They could also consistently score a certain criterion, i.e., Grammar, more harshly than other criteria. Another interaction raters may have is with candidates (test-takers). Raters may consistently score one group of candidates more harshly than others.
• Raters may differ in their interpretation of the scoring criteria, or the descriptors on the rating scale.
• Raters’ scores on distinct criteria (especially on the analytic scale) may be influenced by their overall impression of the performance (halo effect).
• Raters may avoid extreme ends of the rating scale and award scores closer to the mid-point (central tendency effect).
O’Sullivan (2000) draws up a list of physical/physiological, psychological and experiential characteristics that may have an influence on test-takers’ performance on test day (cited in Weir, 2005). Weir (2005) argues that these characteristics are indeed applicable to raters too. There are potentially many physical, psychological and experiential characteristics that influence raters’ performance. Moreover, Bachman (1990, 2004) differentiates between systematic test-taker characteristics (those that consistently affect test-taker performance) and unsystematic ones (those that are more random). Similarly, the above differentials apply to raters. In other words, there are systematic and unsystematic factors that may influence raters when scoring writing and result in construct-irrelevant variance (Van Moere, 2014). Dealing with the unsystematic factors may be troublesome, but “there is a need to identify the different potential sources and forms of systematic rater error” (Johnson and Lim, 2009, p.486).
Conventionally, rater variance has been viewed as a problem and testers generally want a stronger agreement amongst raters in order to reduce differences as much as possible, i.e., a higher reliability coefficient (Weigle, 1998). Even so, the strict increase in reliability (or rater agreement) has come under criticism (Eckes, 2011; Lumley and McNamara, 1995; Weigle, 1998). Pure statistical agreement between raters, according to Johnson and Lim (2009) “illuminates the product of assessment but not its process” (p.486). Moreover, Connor-Linton (1995a) argues that “if we do not know what raters are doing… then we do not know what their ratings mean” even when they agree (p.763). More recently there has been a proposition that rater variance is, in fact, desirable as it allows testers to establish probabilistic scores (Kim and Gennaro, 2012; Weigle, 1998). Raters’ scoring patterns are measured and analysed by means of the Multi-Faceted Rasch Analysis. The software alters test takers’ scores to compensate for any systematic variance a rater may have (Bond and Fox, 2007; Eckes, 2011; McNamara, 1996). This means the software would increase the scores of test-takers who were rated by systematically harsh raters and decrease those given by systematically lenient raters.
Thus, instead of trying to reduce rater variance to zero, which is most likely impossible and perhaps undesirable (Kim and Gennaro, 2012, p.320), test administers should seek to identify any, if not all sources of potential rater variance, especially the systematic ones, to ensure better scoring validity. So long as direct writing tests are used and scored by human raters, sources of rater variance need to be identified and managed (McNamara, 2000; Van Moere, 2014). It was mentioned earlier that there are a number of physical (age, sex, illness, disabilities, etc.), psychological (personality, memory, motivation, cognitive style, etc.) and experiential characteristics (language background, education, experience, etc.) that may influence raters and result in rater variation (Shaw and Weir, 2007, p.168). Shaw and Weir argue that the physical and psychological factors “may not lend themselves to future investigation or not be considered worth the effort” (ibid: 168), but on the other hand, experiential factors can be more easily identified and addressed and have thus received the lion’s share of research attention. In addition, experiential factors are more likely to have a systematic effect on raters. The next section will look into the experiential factors that may cause rater variation.
2.8 Rater variance due to experiential factors.
Because raters’ experiential characteristics are usually systematic (consistently affecting raters), they are much easier to detect and more practical to address, compared to the physical and psychological characteristics outlined by O’Sullivan (2000), cited in Weir (2005). That explains the reason they have received the bulk of attention in the literature (see Crusan, 2010, p.87-114; Shaw and Weir, 2007, p.168-172; Weigle, 2002, p.70-72). Some of the experiential characteristics that have been researched include: comparisons of novice and experienced raters’ evaluation of L1 and L2 writing (Breland and Jones, 1984; Connor and Carrel, 1993; Cumming, 1989; Cumming, 1990; Huot, 1988; Keech and McNelly, 1982 cited in Ruth and Murphy, 1988; Sweedler-Brown, 1985), comparisons of ESL/EFL teachers’ evaluations of writing to subject/content area specialists’ evaluations (Mendelson and Cumming, 1987; Santos, 1988; Brown, 1991; Sweedler-Brwon, 1993; Elder, 1992, Weir, 1983; Hamp-Lyons, 1991; Bridgeman and Carlson, 1983; Song and Caruso, 1996; O’Loughlin, 1992), analysis of features of writing that influences raters’ overall judgments (Vaughan, 1991; Lumley, 2002 and 2005; Connor-Linton, 1995b; Shi, 2001), the influence of rater training (O’Sullivan and Rignal, 2007; Shohamy et al., 1992; Weigle, 1994, 1998), and the influence raters’ expectations have on evaluations (Stock and Robinson, 1987; Diederich, 1974; Powers et al., 1994).
One of the most salient experiential characteristics that has been found to influence the process of scoring written work is raters’ L1 and their familiarity with grammatical/rhetorical/discourse features of the test-takers’ L1 (Johnson and Lim, 2009; Shaw and Weir, 2007; Van Moere, 2014; Weigle, 2002). Several studies have been carried out comparing how NES and NNS differ when scoring writing. Some believe that NES raters should be the norm, whereas others believe they should be the exception (Johnson and Lim, 2009, p.486). Others, however, argue that NNS are the ideal raters for certain settings (Hill, 1996). A case is also made for collaboration; having one NES and one NNS score a written script and then averaging the score. This, it is argued, could balance out, or at least limit, any potential rater biases (Van Moere, 2014, p.4). The following chapter (Chapter III) will shed light on the literature that has investigated the way raters’ L1 influences their perception of written work, but firstly, it is crucial to explore the measures taken in the field of language testing to overcome rater variance.
2.9 Overcoming rater variance.
According to Eckes (2011), there are generally two approaches found in the language testing literature to overcome rater variance in performance-based language assessment (writing and speaking): the standard approach and the measurement approach. Yet, in many language testing settings, it is not uncommon for test administers to completely ignore the issue and take raw scores awarded by raters at face value (Bond and Fox, 2007; McNamara, 1996; Weigle, 2002). The following two sections cover the aforementioned approaches to dealing with rater variance.
2.9.1 The standard approach.
An attempt to visually summarize the standard approach to dealing with rater variance in performance-based language assessment is made in figure 2.3 (adapted from Eckes, 2011; McNamara, 1996; Weigle, 2002).
The first step in any language testing setting is to define the construct one wishes to measure with the specified levels of performance (see section 2.1.1). The following step is to establish (develop or implement) an appropriate rating scale with carefully worded descriptors and criteria that adequately distinguish between the performance levels that were agreed upon in the previous stage (defining a construct). This stage is a crucial one since rating scales give rise to a number of dilemmas. McNamara (1996), for example, states that raters can systematically differ in their interpretations of the various levels/criteria of the rating scale. He also found that raters tended to over-emphasise the importance and weight of criteria they deemed important even when the test administers explicitly instructed they to downplay the criteria. Similarly, Lumley (2002 and 2005), who investigated what criteria meant to raters, observed that raters were heavily influenced by their own complex impressions of written scripts, and that they had a tough task reconciling that impression with the wording of the criteria on the rating scales. In other words, he observed a tension between raters’ intuitive impressions and the wording of the descriptors of the rating scales. He does, however, conclude that despite this tension, raters with adequate training can yield consistent scores. Moreover, Eckes (2012) found that raters exhibited biases to criteria they felt were most important (see section 3.3.4).

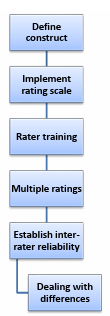
Other issues pertinent to rating scales are the central tendency effect, the halo effect, and transfer of judgment effect that raters may display when using the scales. These effects are sometimes referred to as ‘errors’ in the literature (Engelhard, 1994). The central tendency effect is exhibited when raters play it safe by awarding scores in the mid-way point of the rating scale, and avoid scores at the higher and lower ends of the scale (McNamara, 1996, p.124). Engelhard (1994) notes that it is possible for raters to also exhibit a central tendency effect by consistently overusing the extreme upper or lower scores on the scale (p. 99). The halo effect occurs when raters’ scores on specific criteria on the analytic rating scale are influenced by their overall impression of the performance (Eckes, 2011). Engelhard (1994, p.99) states that the halo effect, in essence, occurs when a holistic rating is awarded when using an analytic scale. This is evident when a rater exhibits an excessive number of uniform ratings on each script- that is, constantly awarding a score of 3 or 4 to all the criteria of the analytic scale when rating each script. Similarly, transfer of judgment effect manifests itself “when [a] rater’s impression of one of the candidate’s (test-taker’s) attributes affect his/her judgment of another attribute” (Van Moere, 2014, p.4). For example, micro features of writing, like grammar, could influence a rater’s perception of some macro features, like organization. See section 2.6 for more on rating scales.
After a construct has been defined and a rating scale implemented, raters are usually trained to establish a common understanding of the construct and the rating scale. In moderation sessions, raters are asked to rate a number of selected scripts representing the various performance levels that were previously defined. Subsequent moderation sessions provide feedback to the raters on their performance and the extent of their agreement. A decision is then made on which raters performed satisfactorily, usually based on their inter-rater reliability estimates (McNamara, 1996). The efficacy of rater training has been investigated in a number of studies (Eckes, 2011; Lumley and McNamara, 1995; O’Sullivan and Rignal, 2007; Weigle, 1998). McNamara (1996) argues that rater variance still persists after training, and that variation is merely reduced in the process. More importantly, he states that the variance in scores after rater training can still have crucial consequences on the test-takers (ibid: p.118). In other words, test-takers’ success (or failure) on a writing test is a product of not only their writing ability, but also the rater who was assigned to score them. Weigle (1998) found that rater training was beneficial for improving raters’ self-consistency (intra-rater reliability). She also found that training was useful for identifying extreme outliers (raters who awarded scores that were extremely higher or lower than the rest), and bringing them into line with other raters. Yet, she noted that although training reduced variability in scores, it could not eliminate it, especially in cases of systematic severity (or leniency) – that is, raters who consistently awarded higher or lower scores than the others. Significant differences in overall severity still persisted.
Thus, according to Weigle (1998) training helped raters award predictable scores (intra rater reliability) and not identical scores (inter-rater reliability). Similar findings are found in Eckes (2004, 2005, 2010, cited in Eckes 2011), Kondo-Brown (2002), Lumley and McNamara (1995) and O’Sullivan and Rignal (2007). In addition, Wigglesworth (1993) noted that rater performance feedback did contribute to ‘reduced’ rater biases (p.318), but in a follow-up study Lunt et al (1994) found that there were no significant changes in rating behaviour. This confirms Weigle’s (1998) aforementioned finding that training cannot eliminate systematic rater severity and biases. Establishing inter-rater reliability is a step that goes hand-in-hand with rater training and is a necessity in the standard approach to dealing with rater variation. It is one of the main goals of rater training, and a prerequisite for operational testing. The idea being that when inter-rater reliability estimates between two (or more) raters are high enough (usually .80 and above), they are said to be able to function interchangeably because they share a common understanding of the construct and rating scale (Bond and Fox, 2007; Eckes, 2011). In other words, “whichever rater is making the judgment should be a matter of indifference to the test-taker” (Fulcher, 2010, p.52-53). If this is the case (raters achieve high inter-rater reliability estimates), then it is argued that rater variation is negligible, and this contributes to the argument of the validity of test scores (Bachman and Palmer, 2010; Hyland, 2003).
However, both high and low inter-rater reliability estimates, in and of themselves, can be very misleading. High estimates could mask systematic differences between raters in terms of their overall severity or leniency (Bond and Fox, 2007; Eckes, 2011). For example (adapted from Bond and Fox (2007), and McNamara (1996)), let us assume there are two raters (Maria and Ali) who score 5 essays (on a scale of 1-10). Their hypothetical scores on each essay are presented in table 2.3.

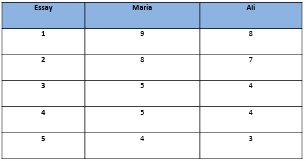
The scores appear very similar. Both raters had adjacent scores on every essay. Moreover, the inter rater reliability of the two raters is a perfect 1, since the rank order of the essays is identical (both raters awarded essay 1 the highest score, essay 2 the second highest, etc.). If the cut-off score to this test is 5 (the minimum score a test-taker must achieve in order to pass), then would the two raters function interchangeably in such a case? Would the choice of rater make a difference? What are the consequences for the test-takers if they were rated by either one? Assuming a cut-off score of 5, then only one of the five test-takers would fail if they were scored by Maria (essay 5), whereas three test-takers would fail if they were rated by Ali (essays 3, 4 and 5). As a result, there are two test-takers (essays 3 and 4) whose pass/fail decision rests in the hands of the rater.
These scores demonstrate that one rater (Maria) is systematically more lenient that the other (Ali). Further, we see in table 2.3 that essay 1 was awarded 8 (out of 10) by Ali and essay 2 was also awarded 8 (out of 10) by Maria. Based on what is known about the two raters, it is clear that essays 1 and 2 are not equally proficient despite having been awarded the same score. The high inter-rater reliability estimates of Maria and Ali is due to their identical rank order of the essays. This is usually measured using the Pearson’s r and/or the Kendall’s Tau-b. Some have argued that the way around this conundrum is to calculate an alternative reliability coefficient based on
exact agreement (raters’ consensus) rather than (or along with) rank order (raters’ consistency) (Tinsley and Weiss, 2000). Rater consensus reliability estimates are usually calculated using Exact Agreement estimates and/or Cohen’s Weighted Kappa. Since Maria and Ali have no cases of exact agreement, then the consensus inter-rater reliability estimates will be much lower. However, this new estimate proves not very useful and has its limitations. For example, (adapted from Eckes, 2011), what if two new raters (Zahra and Noor) were added to the previous hypothetical test setting? Their scores to the 5 essays are reported (along with the previous scores of Maria and Ali) in table 2.4.
It can be observed that the two new raters gave scores which matched those of the previous raters. The paring of Maria x Noor and Ali x Zahra showed identical scores. As a result, the inter-rater reliability estimate of both pairs of raters (Maria x Noor and Ali x Zahra) is extremely high. In this case, it makes no difference which estimate is calculated (consistency estimates or consensus estimates), as the reliability remains ideal.

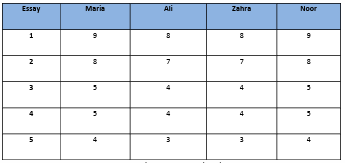
What these estimates fail to take into consideration is the overall systematic leniency and severity of each paring of raters respectively. The paring of Maria x Noor has extremely high inter-rater reliability estimates, but these high estimates do not take into account that they were both systematically more lenient when scoring the essays compared to the pairing of Ali x Zahra. Thus, essays 3 and 4’s chances of passing/failing the writing test (achieving a score of 5 out of 10 on the essay) is dependent on their luck of the draw. If the pairing of Maria x Noor were to rate them, they would pass, whereas the pairing of Ali x Zahra would result in a fail. It has been demonstrated how very high inter-rater reliability estimates (consistency and consensus estimates) can mask systematic rater severity (or leniency), and thus threaten the validity of writing test scores (Bond and Fox, 2007; Eckes, 2011; McNamara, 1996). It is worth analysing the other end of the reliability spectrum: low inter-rater reliability estimates. Tinsley and Weiss (2000) believe that raters who exhibit low inter-rater reliability estimates cannot be used and that their scores cannot be valid (ibid: p.101). Eckes (2011, p.29), however, makes a case for the inclusion of some raters with very low inter-rater reliability estimates. Using test scores from the writing section of the Test DAF, he presented cases where pairs of raters had extremely low inter-rater reliability consistency estimates (Pearson’s r = .21, Kendall’s Tau-b = .26) and consensus estimates (Exact Agreement = .10, Cohen’s weighted Kappa = .00), yet shared a degree of regularity that these estimates missed.
Even though their scores were markedly different, Eckes makes a case for the inclusion of these raters, providing their differences can be taken into consideration (see next section). It is worth noting that even though the example given here is a hypothetical one for the purpose of clarity, significant differences in degrees of severity between highly trained raters are a reality (see Englehard, 1992 and 1994; Saiedi et al., 2013, and Chapter 3). In the standard approach to dealing with rater variation, an effort is usually made to resolve discrepancies between raters’ scores (Johnson et al., 2000; Johnson et. al., 2005; Henning et al., 1995; Myford and Wolfe, 2002; Weigle, 2002). Much of the time, discrepant scores are totalled and the average score is reported. Sometimes, when the differences between two raters’ scores is more than one band score, a third experienced rater is brought in to rate the script. Other times, raters who award discrepant scores are invited to discuss their differences and negotiate a score. All these methods, however, fall short in dealing with rater variation since they do not account for a systematic degree of rater severity (or leniency) (Eckes, 2011; McNamara, 1996). If, for example, an extremely harsh rater awarded an essay a score of 3 (out of 10) and another harsh rater, though not so extreme, awarded the same script a 5, then the average score would be 4 (out of 10). This reported average does not illuminate the nature and degree of severity displayed by both raters. As a result, the raw score awarded to this test-taker is influenced by rater characteristics resulting in construct-irrelevant variance.
This section explored the standard approach to dealing with rater variance. After defining a construct and establishing a rating scale, raters are trained, written scripts are scored by multiple raters, inter-rater reliability is established, and if estimates are satisfactory, scores are then reported. Yet these procedures have their limitations and do not contribute much to the validity argument. Training helps raters become more consistent internally (intra-rater reliability), yet does not diminish rater variance. Multiple ratings and high inter-rater reliability estimates can mask overall rater severity (or leniency) Moreover, low inter-rater reliabilities leads to hastily dismissing raters who could potentially be useful. An alternative approach is to take into consideration rater characteristics (like internal consistency and systematic overall severity) along with other factors that may contribute to rater variance by estimating their effect on the score, and producing a ‘fair score’ that reflects test-takers’ ability in light of these contributing factors. In other words, test-takers’ writing ability is measured in light of what we know about other contributing factors in the assessment setting, such as rater severity. This approach is known as the Measurement approach and will be discussed in the next section.
2.9.2 The measurement approach.
This approach to dealing with rater variance utilizes Multi-Facet Rasch Measurement (MFRM), an extension of the Rasch model. It shares with the standard approach the initial stages, i.e., defining a construct and establishing a rating scale. The approach also utilizes rater training, though it differs in purpose and rater feedback.
The basic Rasch model is a theory of probability that states that the probability of a test-taker responding to an item (test question/task) correctly is the function of the test-takers’ ability and item difficulty (Bond and Fox, 2007). For example, the chances of a test-taker with a very high level of proficiency (ability) answering an easy item correctly are very high compared to a test-taker with low proficiency. Conversely, the chances of a student with low proficiency (ability) answering a very difficult item correctly, are very low. However, in testing writing, a rater is required to assign a subjective score to the script. It was demonstrated in the previous section (2.7) that raters vary in their degree of severity (see also Chapter III). Thus, the probability of a test-taker getting a particular score on a writing test is a function of the test taker’s ability, the item difficulty, and rater severity.
The MFRM enables us to illuminate the nature and extent of rater severity, quantify its influence on test-takers’ raw score, and provide a ‘fair score’ that compensates for any systematic rater severity effects (McNamara, 1996, p.119). Moreover, it also enables us to explore and detect the influence other factors (known as facets) in the assessment setting have had on test-takers’ scores. Ideally, the variation in test-takers’ scores on any test should be due only to their ability/proficiency in the construct being measured (Bachman and Palmer, 2010). However, there are many other facets in the assessment setting, other than ability, that can contribute directly (or indirectly) to variance in scores. These facets could be related to the test-takers, the task, the raters, the rating scale, the test setting and the rating setting among other things. Facets like test-takers’ first language (L1), background knowledge, motivation, gender, etc., can all contribute to variation in their test scores. Similarly, raters’ L1, experience, training, attitude, etc., can contribute to variation in test scores. The facets are presented visually in figure 2.4 (adapted from Eckes, 2011; Fulcher, 2003; Shaw and Weir, 2007; Weigle, 2002).

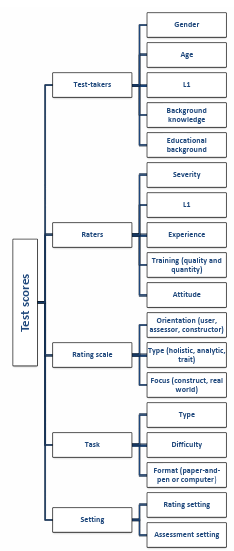
The MFRM allows us to measure the extent of influence any facet of interest has had on test scores. The facets explored could be born out of the literature, or from observations made in assessment settings, or explorations for research purposes (Eckes, 2011; McNamara, 1996). In particular, MFRM can produce measures of:
• Rater severity (a measure of the degree of severity each rater exhibited).
• ‘Fair scores’ that compensate for rater severity (the score a test-taker would have obtained if a rater of average severity had rated them).
• Task difficulty (useful when test-takers had a choice of more than one task).
• Rating scale criterion difficulty.
• Fit indices (analyses of rater consistency which are crucial in rater raining, monitoring, and feedback, and also detecting central tendency and halo effects).
• Rating scale functioning (how well each criterion level is separated).
• Bias analysis (the interaction effect of two (or more) facets combined). (Eckes, 2011; Green, 2013; McNamara, 1996; Bond and Fox, 2007).
One of the main strengths of MFRM is that not only can it provide an estimate of the influence each facet has had on test scores independently, it can also detect the influence of an interaction of two (or more) facets (Eckes, 2011; McNamara, 1996). This is known as bias analysis (also known as Interaction analysis or Differential Facet Functioning). For example, it has been shown that the facet ‘severity’ under ‘rater’ in figure 2.3 can influence the score a test-taker is awarded. MFRM provides an estimate of the degree of severity each rater exhibited. This is useful in understanding what test scores really mean. However, it is also likely that raters’ severity is linked with other facets found in figure 2.3. Raters could be more severe when scoring a particular type of test-taker, a particular type of task, when using a particular type of rating scale, or when rating in a particular type of setting. In’nami and Koizumi (2015), for example, using the MFRM, found that raters and tasks as independent and individual facets resulted in test score variance. However, a much greater percentage of the variance in scores was attributed to the interaction between the two aforementioned facets. Likewise, Barkoui (2010) found that the two facets, raters’ experience (novice vs experienced) and rating scale type (holistic vs analytic), had effects on the variation of scores both independently and as an interaction. Similar studies more pertinent to this investigation are covered in section 3.3.
2.10 Chapter 2 conclusion.
Writing ability is one of the language skills constantly tested in nearly every academic context around the world. Students are, in many academic contexts, required to display their proficiency in writing to gain entry to, or graduate from many educational institutes.
Assessing writing ability via the timed essay is the most commonly found form of assessment in academic institutions. This form of assessment is product-oriented, rather than process-oriented, and is measured ‘directly’, as opposed to ‘indirectly’ in most academic settings. As a consequence, raters are required to judge written scripts and assign scores subjectively using a rating scale. This introduces the possibility of rater variance, a significant source of construct-irrelevant variance. Rating in this way has been criticized because it is very subjective in nature. Any number of factors or rater characteristics may influence the final scores. Language testers are keen to identify and address these characteristics and factors in order to minimize, or overcome their influence. Experiential factors have been shown to be a significant source of systematic rater variance, and have thus been studied and explored extensively. One of the most salient experiential factors that has been found to influence raters’ assessment of writing is their L1 in general, and in particular their L1 in relation to the test-takers’ L1. There are two general approaches to overcoming rater variance; the standard approach and the measurement approach. The former emphasises rater training, multiple ratings and establishing high inter-rater reliability estimates to overcome the influence raters have on test scores. This approach, however, cannot take into consideration the degree of systematic rater severity (or leniency). The latter approach, using the MFRM, does take this into account and can thus make a stronger validity argument.
The following chapter covers a range of studies that have analysed the influence raters’ L1 has had on their assessment of writing together with the influence students’ L1 rhetorical patterns have had on raters.
Chapter III
Literature review II (Research overview).
This chapter sheds light on some of the studies that have been carried out to establish the influence raters’ language background has on writing evaluation and its role in rater variation. The first group of studies were those of error gravity (section 3.1), where researchers compared how raters from various backgrounds (NES and NNS) locate and rate errors in terms of severity in erroneous sentences (section 3.1.1) and texts (section 3.1.2). The second group of studies were comparisons of NES and NNS evaluation of writing using authentic texts and holistic or analytic scales (section 3.2). Studies of bias analysis using the MFRM will be the focus of the following section (3.3), where the question of how raters’ (NES and/or NNS) biases towards aspects other than writing ability, may influence their evaluation of writing and result in rater variance. Finally, the influence that sentence length and syntactic simplicity may have on NES and NNS’ evaluation of writing will be covered in section 3.4.
3.1 Error perception studies.
Much of the earlier literature that compared how NES and NNS evaluated writing was done by analysing how each group perceived errors in writing. Most of these studies were written during a time when indirect forms of writing assessment dominated the language testing world (Hamp-Lyons, 1991). The focus of research and teaching writing during that period was linguistic correctness (form and accuracy) and the production of error-free writing (Crusan, 2014, p.2; Hyland, 2003). As a result, analyses of student errors in writing and their influence on raters was the focus of many studies during that period.
Some of these studies compared how NES and NNS perceived and rated errors in de-contextualized sentences, and others focused on how they rated errors in authentic texts. The following two sections shed light on both types of literature.
3.1.1 NES and NNS evaluation of errors in sentences.
One of the first researchers who explicitly set out to explore the differences between NES and NNS’ (of various backgrounds) evaluation of written work was James (1977). The main focus of his study, however, was how each group (NES and NNS) rated errors in terms of severity. Raters were not presented with authentic texts, but rather they were presented with sentences that supposedly contained the most common errors in written work. By asking the raters to underline the error in each sentence and rate it in terms of severity on a 6-point scale (0-5; a score of 5 meaning the error was most severe and 1 meaning it was not at all severe), he found that: (1) NES were more tolerant of written errors, and (2) NES deducted the most points for errors related to tense, whereas NNS deducted the most points for lexical errors.
Hughes and Lascaratou (1982), Davies (1983), and Sheory (1986) were all inspired by James’ (1977) investigation. They used it as a blueprint for their own investigations and made efforts to refine it. Hughes and Lascaratou (1982) compared NNS of the same background (Greek) as opposed to various backgrounds, as was the case with James (1977). They also compared the two groups of raters (NES and NNS teachers) to a new group: NES non-teachers. They, like James (1977), presented their raters with sentences, asked them locate the errors and rate them in terms of severity using a 6-point scale. Unlike James (1977), however, they asked their raters to give the reasons for their ratings.
Similar to Hughes and Lascaratou (1982), Davies (1983) was interested in comparing NNS Moroccan teachers to NES non-teachers’ evaluation of errors, again using a 6-point scale. Like Hughes and Lascaratou (1982), she also asked her raters to make comments on the erroneous sentences. The comparison of Indian teachers with English as a Second Language (ESL) to NES teachers’ evaluation of written errors, again using a 6-point scale, was the focus of Sheory’s (1986) investigation. She, however, differed by presenting raters with erroneous sentences written by students of various proficiency levels and from a variety of backgrounds (NES and NNS). Moreover, she differed from previous researchers by not asking raters to underline the error in each sentence, but simply to give the sentence a score using the scale.
All the investigations above yielded similar results, namely, NES raters were more tolerant of written errors. Hughes and Lascaratou (1982) and Sheory (1986) reported a significant difference between the marks deducted by each group, although a p value was not reported. Davies (1983), on the other hand, reported a highly significant difference between the marks deducted by each group (with a p value of < .001). Upon observation of the reasons given, Hughes and Lascaratou (1982) and Davies (1983) found that NES deducted the most points for errors that affected comprehension, whereas NNS were simply concerned with accuracy and rule infringement. They argued in favour of Nickels’ (1973) assumption that this is a result of NES’ superior linguistic competence. Davies (1983) argued that these findings may be due to NES accepting certain errors which have become acceptable in everyday English. Moreover, she believed that NNS’ focus on accuracy may have been a result of them sharing the students’ L1 and, as a result, they had comprehended what students were trying to say in most of the erroneous sentences. One of the major drawbacks of the previous research was that it focused on sentences as opposed to whole authentic written texts (Khalil, 1985; Green and Hecht, 1985; Kobayashi, 1992). As a result, global features of writing (organization, coherence, cohesion, etc) were not taken into account.
Furthermore, a de-contextualized erroneous sentence may be scored completely differently when a context is given. Below is a summary of the main findings of the literature reviewed in this section:
• NES deducted fewer marks for the erroneous sentences and were thus deemed more tolerant of written errors than NNS.
• NES deducted the most marks for errors that affected comprehension.
• NNS deducted the most marks for errors that violated linguistic rules.
3.1.2 NES and NNS evaluation of errors in texts.
It is quite possible that the first investigation that compared NES to NNS evaluation of errors in written work using an authentic piece of writing was conducted by Green and Hecht (1985). They asked their raters (NES teachers and German NNS teachers) to locate the errors in 106 pieces of writing (written by NNS and NES students), judge their severity using a 3-point scale as opposed to the 6-point scale used exclusively in the research above, and make corrections. Green and Hecht (1985) placed all the judgments and corrections they had collected into four categories: grammar, vocabulary, style and spelling. Each category, moreover, had sub-categories.
They too, as with the previous researchers (James, 1977; Hughes and Lascaratou, 1982; Davies, 1983; Sheory, 1986), found that NES were more lenient and tolerant of students’ errors. They also found that NES, unlike the NNS, showed strong agreement when judging severity of errors in the sub- category of ‘organisation’. However, they found the opposite with sub-category ‘concept’; NNS showed a high level of agreement compared with NES. It should be noted that these judgments of ‘agreement’ were based on observations from the researchers and not any Standard Deviation (SD) or reliability coefficient. Finally, Green and Hecht (1985), like Hughes and Lascaratou (1982) and Davies (1983), found that NES judged errors that affected comprehension most severely, whereas NNS focused primarily on form and accuracy.
Another researcher who compared how teachers perceived errors using authentic pieces of writing was Santos (1988). His comparison, however, was on a much larger scale. In an attempt to establish the significant factors that influence the rating of written work, he asked 178 university professors from various age groups, departments and language backgrounds (NNS and NES) to correct two long written scripts and rank the three most serious errors. He found that the older professors were significantly more tolerant of errors than the younger ones, and that the NES professors were significantly more tolerant of errors than NNS. This was in accordance with what previous research had established (James, 1977; Hughes and Lascaratou, 1982, Davies, 1983; Green and Hecht, 1985, Sheory, 1986). He too, like Davies (1983), Green and Hecht (1985), and Hughes and Lascaratou (1982), found that NES focused more on intelligibility whereas NNS focused more on form and accuracy.
The first investigation to yield contradictory findings was one conducted by Kobayashi (1992). Using a 10-point analytic scale, she compared how a variety of NES (teachers, post-graduate and undergraduate students) and a variety of NNS (teachers, post-graduate and undergraduate students) rated authentic written scripts. Her findings suggest that NNS are, in fact, more lenient scorers of grammar, whereas clarity, naturalness and organization were scored more leniently by the NES group. James (1977) did note that his NNS, who were from various backgrounds, could be divided into two groups: NNS who were more tolerant of errors and NNS who were less tolerant of errors. One may wonder whether nationality played a role in such an observation and it is worth investigating to which group Arab NNS in Kuwait would belong. Moreover, she found that the NES group located and corrected more errors than the NNS.
In an attempt to parallel and refine Hughes and Lascaratou’s (1982) investigation, Hyland and Anan (2006) compared three groups of raters: NES teachers, NNS (Japanese) teachers and NES non teachers’ evaluation of writing. They, however, used an authentic script of writing. Their participants were required to: (a) locate the errors, (b) write a correction, (c) assign a score using a 10-point holistic scale, and (d) select and rank the three most serious errors and give reasons for their choices. Hyland and Anan’s (2006) findings were in accordance with all the previous literature, except Kobayashi (1992). They found that: NES were more lenient scorers of writing and focused mainly on intelligibility and comprehension, whereas NNS focused primarily on accuracy and form. They also argued in favour of Davies’ (1983) suggestion that because NNS shared the students’ L1, they did not focus much on aspects of intelligibility. Sharing the students’ L1 probably helped NNS teachers to fully grasp the intended meaning of an erroneous sentence that NES found difficulty in comprehending. Hyland and Anan (2006) also found, contrary to Kobayashi (1992), that the NNS were better error hunters- that is they located and corrected far more errors than the two groups of NES. This, they speculated, was a result of the NNS’ belief that finding and correcting every error was their duty.
A summary of the key findings of section (3.1) is presented below:
• All the literature found that NES were more tolerant of erroneous sentences except Kobayashi (1992) who found NNS to be more tolerant of grammatical errors.
• The NES were primarily concerned with aspects of intelligibility and comprehension, whereas the NNS were concerned with aspects of language form and rule infringement.
• Some studies found that NES were better at locating errors in texts (Kobayashi, 1992), whereas others found the opposite (Hyland and Anan, 2006).
3.2 NES and NNS evaluation of authentic written work.
The previous studies (section 3.1) focused on raters’ evaluation of error severity in writing. Latterly, a shift would occur in the literature that focused more on the meaning of writing, rather than on linguistic correctness (Hyland, 2003). More studies were conducted to focus on the assessment of actual writing, as opposed to the assessment of writing sub-skills (Crusan, 2014; Hamp-Lyons, 1991; Weigle, 2002, see section 2.3). Studies in this section (3.2) compared NES’ and NNS’ evaluation of student writing. A rating scale is used in most cases. This is a far more natural approach to writing assessment, than error evaluation.
Land and Whitely (1986 cited in Land and Whitely, 1989) set out to establish whether the L1 status of a reader would influence their perception and evaluation of student essays. Half of the essays being evaluated were written by NES freshman students and the other half by NNS freshman. They were not surprised to find that the NES readers rated the essays written by NES students higher than the essays written by the NNS. The NNS readers, other hand, rated both essay types rather equally. Moreover, the feature NES marked down the most on the NNS essay was organization. The NNS readers, however, did not find any problems with the organization of the essays written by NNS students. Land and Whitely conclude that NNS, bilingual and multilingual readers, because of their exposure to different types of rhetorical organization, can value essays written by NNS students more so than NES readers.
It is worth noting that the readers in Land and Whitely’s study were not teachers. Teachers and students of the same L1 have been found to significantly differ in their evaluation of writing (Kobayashi and Rinnert, 1996). In fact, teachers differ significantly in their evaluation of writing based on their years of teaching experience (Santos, 1988). It is debatable whether these results would carry over when applied in a more natural rating setting. For example, when analysing NES and NNS German teachers’ evaluation of writing, Green and Hecht (1985) found the opposite of Land and Whitely in terms of evaluation of Organization. It was the NES who were both more lenient and consistent (see section 3.1.2).
Like Land and Whitely, Hinkel (1994) also sought to ascertain whether NES students and advanced NNS students from various Asian backgrounds differed in their evaluation of texts written by NES students (with rhetorical notions accepted in the U.S academic environment) and advanced NNS students (with Confucian and Taoist rhetorical notions). She carried out two experiments whereby each group (NES students and advanced NNS students) were handed two texts; one written by a NES student and the other by an advanced NNS student. All four texts were very similar in style and had been edited for grammatical and lexical accuracy.
Participants were presented with two texts at a time (one written by the NES students and the other by the advanced NNS student), and were asked to decide which text was better with reference to a number of features. They were asked which text they liked more, which text was easier to understand, which was more explicit, which was more convincing, which was more specific, etc. Whereas the NES readers almost unanimously chose the script written by the NES student on nearly every feature, there was much disagreement amongst the NNS readers. For example, in the first experiment, 93% of the NES thought the script written by the NES student was more convincing, whereas approximately 50% of the NNS found the NNS script more convincing. The overall differences between the two groups (NES and NNS) were statistically significant (p< .05). Moreover, the NNS readers also differed significantly in their perceptions based on their background (Chinese, Korean, Japanese, Indonesian, and Vietnamese). On more than one feature the NNS readers were divided equally in terms of which text they preferred.
Similar to Land and Whitely (1989), it is arguable whether these results would carry over to NES and NNS teachers. Furthermore, having readers choose one text over another was extremely problematic because it does not take into account how certain features on one text may be better than the other. While it may be easy for two raters to agree that they like text A more (or found it easier to understand/more convincing/more specific, more explicit, etc.) than text B, the question of ‘how much’ remains unanswered. One rater may have liked them both but found that text A was only slightly better, whereas another rater may have liked text A significantly more than B. Thus, the amount of information that is lost when raters are forced to choose in such a manner is immeasurable. Yet, it would be fair to conclude that readers who share the writers’ L1 are more appreciative of their writing in L2 than NES readers.
Connor-Linton (1995b) was perhaps the first to compare NES and NNS evaluation of authentic writing as opposed to error perception. He wanted to establish whether NES ESL teachers and NNS EFL teachers rated written work ‘in the same way’ (ibid: 99). He asked 26 NES American graduate students and 29 NNS Japanese EFL teachers to rate 10 compositions written by Japanese students. Half of the participants were asked to assign a holistic score (no holistic scale or criteria was mentioned in the published article), and the other half to assign an analytic score (again no criteria, descriptors or scale mentioned in the published article) to the compositions. They were then asked to write down the three most influencing reasons for the scores they assigned.
He found that the two groups had an identical inter-rater reliability score (.75). He argued in favour of Hatch and Lazaraton’s (1991) belief that such a finding was not surprising given that the raters had no training. Other literature that Connor-Linton did not refer to also showed that similar reliability coefficients were obtained when raters had no training (Brown, 1991; Shohamy et al., 1992). Furthermore, Connor-Linton (1995b) found that both groups scored the compositions very similarly with a high reliability correlation (r=.89). The discrepancy between the two groups, however, was evident when comparing the qualitative reasons for the given scores. The Chi-square test showed a highly significant difference (p < .001) between the reasons given by each group. Thus both groups arrived at similar scores for completely different reasons. The reasons, moreover, mirrored the findings of previous literature; NES generally focus more on intelligibility and global features of writing, whereas NNS generally focus on form and accuracy (Hughes and Lascaratou, 1982; Davies, 1983; Green and Hecht, 1985; Hyland and Anan, 2006). Finally, NES had a slightly higher mean score (2.64 out of 4) compared with the 2.60 achieved by NNS meaning they scored the scripts slightly more generously.
This was also in accordance with results from previous literature (James, 1977; Hughes and Lascaratou, 1982, Davies, 1983, Green and Hecht, 1985, Sheory, 1986; Santos, 1988; Hyland and Anan, 2006). Connor-Linton (1995b) did speculate whether the topic given to the students (a ‘description of a Japanese holiday’) was one that NNS were much more familiar with than the NES and thus NNS did not focus much on intelligibility. His speculation was in accordance with other literature that suggests that NNS focus less on intelligibility and more on accuracy since they understood what students were trying to say (Davies, 1983; Green and Hecht, 1985; Santos, 1988; Hyland and Anan, 2006). This led me to choose a topic with which I felt all my participants (NES and NNS) would be equally familiar. Having a group of NES with no teaching experience was a limitation in this investigation which I wanted to avoid by ensuring that all of my participants had adequate and similar teaching experience. Another limitation, in my opinion, was the lack of rating scales. Even though Connor Linton (1995b) intended to compare the two groups’ holistic and analytic evaluations, he did so without providing them with descriptors or criteria. I believe that providing a proper scale (holistic or analytic) would have theoretically improved the reliability coefficient, and would have helped to establish whether one group had a higher reliability coefficient than the other when presented with a scale. Kobayashi and Rinnert (1996) set out to establish how rhetorical patterns in the L1 and L2 influence teachers when evaluating writing. Their participants consisted of NNS Japanese students, NNS Japanese teachers, NES students and NES teachers. The 16 written scripts they used in their study, however, were constructed by the researchers to fall into one of the following four categories: (1) error free scripts, (2) scripts with syntactic/lexical errors, (3) scripts with disrupted sequence of ideas, and (4) scripts with both syntactic/lexical errors and disrupted sequence of ideas. Moreover, each of the four categories had a script written in American-English rhetoric and a script written in Japanese rhetoric. These scripts were written to mimic two original student essays.
They felt this approach would control the variables (syntactic/lexical errors, and disturbed sequence of ideas) and enable them to “investigate specific factors on a scale sufficiently large that we could statistically analyse actual as opposed to reported evaluation behaviour” (ibid: 404). Although a few studies in the field have manipulated data this way (see Mendelsohn and Cumming, 1987; Sweedler-Brown, 1993; Weltzien, 1986, cited in Kobayashi and Rinnert, 1996), results of these types of studies will always be questionable (Khalil, 1985). In this case in particular, it is hard to imagine a scenario where a teacher would come across such written scripts. A script with only syntactic/lexical errors or a script with only disrupted sequence of ideas would be virtually impossible to encounter in any authentic piece of writing in L1 or L2.
Participants were asked to rate each script using a 7-point analytic scale with no descriptors. This too was problematic in my opinion for a similar reason to the issue of manipulated data. If the main purpose of the study was to “discover how L1 and L2 rhetorical patterns affect EFL writing evaluation by teachers and students”, then it stands to reason that teachers should evaluate them the same way they would in their normal setting. Analytic scales with no descriptors are not commonly encountered in teaching and evaluation settings (Weigle, 2002; Hamp-Lyons, 1991). Their results, which were analysed using a two-way ANOVA, showed that there were statistically significant differences between the four groups (p< .05). The two teacher groups did not significantly differ in their evaluations, but the NES were slightly more lenient. Moreover, they found that their participants had significantly disagreed in their evaluation of scripts with Japanese rhetorical features (p<.05), more so than their disagreement on the scripts with American rhetorical patterns.
They also found that the scripts with disrupted sequences of ideas were rated more favourably than the scripts with syntactic/lexical errors when combining all four groups of participants. Interestingly, the NES teachers evaluated one of the scripts with Japanese rhetorical patterns more favourably than the American-English one. However, generally speaking, the Japanese NNS teachers were more appreciative of the scripts with Japanese rhetorical patterns than the NES (teachers and students), whereas the NES preferred the scripts with American rhetorical patterns. Kobayashi and Rinnert (1996) did note that NES teachers with more experience in Japan appreciated the scripts with Japanese rhetorical features more than the less experienced ones.
Finally, Kobayashi and Rinnert conclude that raters’ native rhetorical patterns can influence their evaluation of written work, but argue that other features of writing (organization, coherence, etc.) can be more influential in writing assessment. Nevertheless, as stated earlier, it is hard to make generalizations from data manipulated in this manner. Yet, such findings can help us hypothesise that NNS would score scripts written in their L1 rhetorical pattern more favourably than NES. Using Connor-Linton (1995b) as a blueprint, Shi (2001) wanted to verify whether NES and NNS holistically rated written scripts differently and to compare their qualitative judgments on such scores. She asked 46 EFL teachers (23 NES and 23 NNS) to rate holistically on a 10-point scale, 10 random, 250-word scripts written by Chinese university students and then write down three reasons (in rank order) for giving that score. They were not, however, given a holistic scale with any specific criteria. Shi, whose study inspired me to do this research, wanted to examine how the raters “defined the criteria themselves” (ibid: 307). In other words, how much weight each group gave to certain elements of writing. The two groups of raters had similar experience, but almost 40% of them had less than five years of teaching experience. After collecting all the data (writing scores and the three reasons in rank order) Shi and a doctoral student coded the comments using a “key-word analysis based on an initial observation of the comment” (ibid: 308). For example, they looked for an adjective (i.e. good/poor) and the phrase that followed (i.e. ideas/argument/grammar) and placed it into a category as either a positive or negative comment. They coded five major categories (general, content, organization, language, length) containing a total of twelve sub-categories. SPSS was then used to run a reliability check, then MANOVA (an advanced version of ANOVA) to assess the differences between the NES and NNS scores/ratings. Finally, a comparison of the qualitative comments was computed using the Chi-square test.
The results showed that the NES showed greater consistency when scoring as a group with a reliability coefficient of (.88) compared with the NNS who had a coefficient of (.71). It may appear surprising that the NES’ achieved a high reliability coefficient as they had no rater training and were not aided by any type of rating scale with descriptive performance criteria. Shi (2001), on the other hand, did not find this surprising as previous research had shown NES to have high reliability coefficients without any training (Shohamy et al., 1992), but the NES in Shohamy et al. (1992) used holistic and analytic scales to reach such coefficients. Shi (2001) also found a non-significant difference (p > .05) between the holistic scores given by each group. It was, however, observed that NES were more willing to award scores at the extreme upper or lower end of the scale. The analysis of the rank-ordered comments, on the other hand, did reveal a very significant difference (p < .001) between the NES and NNS. Like Brown (1991) and Connor Linton (1995b) the two groups gave similar scores for completely different reasons. The two groups, however, did have a similar tendency to start with positive comments and end with negative ones.
The comments left the impression that they were structured as feedback for the student which resulted in what Hyland and Hyland refer to as ‘sugaring the pill’ (Hyland and Hyland, 2001). Similarly, both groups made positive comments on the category ‘content’ and negative ones on ‘language intelligibility’. Moreover, NES wrote more positive comments (365 comments) than the NNS (280 comments). Unlike previous research that reported the NES to be generally more lenient scorers (Hughes and Lascaratou, 1982; Davies, 1983; Green and Hecht, 1985; Sheory, 1986; Hyland and Anan, 2006), Shi, like Kobayashi (1992), found the NES in her study to be stricter scorers. The NES in Shi’s (2001) study may have significantly (p < .01) made more positive comments on the sub-category ‘language intelligibility’, but they also significantly (p < .01) made more positive and negative comments on ‘language accuracy’. Previous research (e.g. Hughes and Lascaratou, 1982; Davies, 1983, Green and Hecht, 1985; Sheory, 1986; Hyland and Anan, 2006) has shown NES to focus more on ‘language intelligibility’ whereas NNS focus more on grammatical accuracy. Shi confirmed the first half of that finding (NES focus more on ‘intelligibility’), but contradicted the other half of the finding (that NNS focused more on accuracy).
This may be due to an emphasis found in many L2 settings that explicitly instructs teachers to focus less of accuracy and more on overall communicative abilities (see Bachman, 1990). Nonetheless, NNS did make significantly (p < .05) more negative comments in general than the NES. Finally, when observing the rank order of the comments made by each group, there was also a marked difference (p < .05) between what the NES and NNS placed as their first, second and third reason for the given holistic score. The first reason (most important) commented on by both groups was the scripts’ ‘ideas’ and ‘argument’ (both sub-categories of ‘content’). NNS, however, made significantly more comments on ideas than NES. For reason number two (second most important) both groups generally commented on ‘argument’ and ‘intelligibility’, and the NNS focused their comments significantly more (p < .05) than the NES on ‘organization’ and all its sub-categories. For the third and final reason both groups commented mainly on the ‘intelligibility’ of the language, with NES making significantly more (p < .01) comments on this sub-category than the NNS.
Shi (2001) concludes by first criticizing holistic scales. She states that the “discrepancies between the NES and NNS teachers found… confirm the disadvantage of holistic rating being unable to distinguish
accurately various characteristics of students’ writing” (p.312). Below is a summary of the main findings of this section (3.2):
• Both groups (NES and NNS) were fairly consistent in their scoring with adequate reliability coefficients.
• The NES awarded slightly higher scores and were deemed more lenient, except for the NES in Shi’s study (2001).
• There was a non-significant difference in the scores each group awarded, but a highly significant difference in the reasons each group reported.
• The reasons and comments each group reported suggested that NES were mainly concerned with aspects of intelligibility and comprehensibility, whereas NNS were mainly concerned with language accuracy. Shi (2001), however, found the opposite.
3.3 Empirical studies using the Multi-Faceted Rasch Measurement.
As a consequence of direct assessments of writing, and the introduction of raters, a large body of literature has set out to explore and understand how raters can be biased towards aspects other than language performance when scoring spoken or written work. These biases are, naturally, a threat to scoring validity. Rater bias has been defined as a “systematic pattern of rater behaviour that manifests itself in unusually severe (or lenient) ratings associated with a particular aspect of the assessment situation” (Eckes, 2012, p.273). Research that sets out to identify the aforementioned ‘systematic patterns’ of behaviour, occurring from an interaction of a particular rater (or group of raters) with a particular aspect of the rating situation, is known as bias analysis (Wigglesworth, 1993, p.309). The ‘aspects’ or factors, technically known as facets, may refer to a specific type of test-taker (candidate) (Kondo-Brown,2002; Lynch and McNamara, 1998), a specific ethnic group or gender (Du et al., 1996), candidate ability (Kondo-Brown, 2002; Schaefer, 2008), topic type (Du et al., 1996), task type (Lynch and McNamara, 1998; Wigglesworth, 1993), or even a specific rating time (Lumley and McNamara, 1995).
The most common types of bias analysis studies, however, are those that have set out to explore the bias interaction between raters and specific linguistic criteria. Exploring how raters can be subjective and inconsistent when scoring rhetorical, syntactic, lexical and grammatical features of writing commonly found on analytic rating scales, has been the focus of a number of studies. One of the earliest studies that implemented the MFRM to analyse rater behaviour in writing assessment was Engelhard (1992). He investigated the differences in severity degrees between three highly trained raters who rated 15 eighth-grade students in Georgia, US. The raters used a four-point analytic scale with five criteria (content/organization, style, sentence formation, usage, and mechanics). He found that the raters systematically and significantly varied in their severity degrees (MFRM reliability .88, p< .01). He also found that the criterion usage was the most difficult to score (.64 logits), whereas content/organization was the easiest (-.54 logits). These systematic differences in severity degrees were in spite of the fact that the raters exhibited very high inter-rater reliability estimates in rater moderation sessions. The raters showed at least 62% exact agreement with the scores of anchor papers (referred to as validity papers in the study; papers that have been rated by professionals and have agreed upon scores), and 38% adjacent agreement- that is, only one score above or below the score of the anchor papers. Despite the fact that an extremely low number of raters and scripts (essays) were used in this investigation, the results still illuminate the fact that rater-mediated assessments involving well-trained raters could contribute to some construct irrelevant variance. Green (2013), however, believes that such small numbers cannot produce very meaningful results.
Engelhard (1994) conducted a similar study in Georgia to detect various types of rater errors and categorise them using the MFRM. Fifteen raters rated 264 essays (scripts) written by eighth-grade students using the same analytic scale as in the previous study (5 criteria, 4-points). These essays had been benchmarked by professional raters, and were thus anchor papers (referred to as validity papers in the study) to which raters’ scores were to be compared. Each essay was rated by a pair of raters who had been highly trained, as were those in his 1992 study, in rating essays and usage of the analytic scale. He found that the raters in this investigation also significantly differed in their severity degrees (Reliability index .87, p< .01). The rater severity logits ranged from .33 to -1.22. He also noted that nearly half the number of raters awarded a rating which was more lenient than the benchmark scores, whilst the remainder awarded scores that were more severe. There were many cases where students were awarded equal raw scores, but from raters who significantly differed in severity degrees. This is a clear example of construct-irrelevant variance.
Two of the 15 raters appeared to exhibit a halo effect (scoring holistically rather than analytically), both with a MFRM INFIT of .6 and an OUTFIT of .5. However, according to Linacre (2012), an INFIT of .5 or above is within the acceptable parameters. Green (2013) believes that if the INFIT is .5 (or above) then an OUTFIT of .5 (or below) is not so problematic. McNamara (1996), on the other hand, believes that in high stakes tests, the INFIT should be .75 or above, which means that the ratings of these two raters do not fall within the acceptable parameters. Engelhard (1994) also found that there was a highly significant difference between the overall difficulties of each criterion of the analytic scale (Reliability .93, p< .01). The criteria ‘sentence formation’ and ‘usage’ were the most difficult to score, whereas the criteria ‘style’ and ‘mechanics’ were the easiest. He also found that raters exhibited a central tendency effect as 80% of the ratings were in the middle scores of the rating scale. This, however, could actually be due to the fact that the majority of students, all eighth-graders, shared similar writing abilities. Had a number of higher and lower grade students’ writings been included, it is probable that raters would not have shown restriction in their usage of the range of scores available on the analytic scale.
Similar findings to Engelhard’s studies in 1992 and 1994 were also found in his 1996 study where he noted that raters’ accuracy was dependent on the script they were rating. On some scripts, raters were more accurate than others (their ratings matched those of the benchmark performances rated by expert raters). However, it is worth mentioning that even the benchmark performances by the expert raters to which the operational raters were to be compared, also significantly differ in their severity degrees (Reliability .83, p< .01).
Wiggles worth (1993) found that some of her raters were biased towards grammar, fluency and vocabulary, consistently scoring them more severely or leniently than expected. This study, however, was on the evaluation of spoken output and not writing, even though there is some crossover between the two (Eckes, 2005). Nonetheless, comparing raters’ behaviour when rating a live interview to their behaviour when rating a tape she did find that each rater exhibited a unique behaviour and pattern. From an analysis of how trained raters scored the Occupational English Test, McNamara (1996) also found that raters showed significant bias towards grammar, even though the test was communicative in nature and grammatical accuracy was downplayed. He noted that his raters were unaware of how grammatical accuracy was, in point of fact, influencing their ratings.
Together with Wigglesworth (1993) and McNamara (1996), Lumley (2005) also found that his four trained raters differed consistently when scoring the writing component of the Special Test of English Proficiency. They too displayed bias towards grammar and scored it more severely. Kondo-Brown (2002) analyzed how three native Japanese speaking teachers/raters with similar qualifications, backgrounds and experience rated 234 scripts of Japanese L2 students’ writing. She wanted to establish whether her raters showed a bias towards a specific category/criterion (Organization, Content, Vocabulary, Mechanics, and Grammar), or a specific candidate (year of study, major, L1 and level). Her results showed that raters were self-consistent and their differences were small but significant. Every rater displayed a unique bias pattern towards category and candidates. No clear systematic sub-pattern, however, was identified. Pertinent to rater-category interactions, one rater was harsher on vocabulary, but more lenient on content. The second rater was harsher on content, but more lenient on mechanics. The third was harsher on mechanics but more lenient on vocabulary. With reference to rater-candidate interactions, no clear pattern emerged, but it was observed that candidates with extremely high or low abilities were subject to a significantly higher percentage of bias interactions. She concluded that trained raters may be “self-consistent and overlapping in some ways, but at the same time, they may be idiosyncratic” (p.25).
Having only three raters was, perhaps, the reason why no clear bias pattern emerged in Kondo Brown’s (2002) study. Schaefer (2008), on the other hand, tried to overcome this limitation by analysing forty NES raters’ grading of forty essays. All the essays were on the same topic and written by female Japanese EFL students. A clearer, yet inconclusive, pattern did occur in his results when analysing rater-category interactions; raters who were biased (severe or lenient) towards category content and/or organization tended to show the opposite bias towards language use and/or mechanics, i.e., a negative correlation. Moreover, like Kondo-Brown (2002), Schaefer also found that his raters showed a higher percentage of bias interactions towards writers of higher or lower abilities. He did, however, note that the bias interaction patterns presented did not apply to all of his raters. This was in accordance with Kondo-Brown’s (2002) assertion that bias patterns “can be very complicated and variable” (p.24).
In an attempt to explain Schaefer’s (2008) observation regarding rater-category bias interaction patterns, Eckes focused on the relationship between raters’ perception of criterion importance and their bias towards that criterion, by combining two studies (2008 and 2012). The first (2008) was pertinent to rater cognition (raters’ perception of the importance of each criterion) and the latter (2012) was pertinent to bias analysis and rater category interaction. Eckes (2012), like Kondo-Brown (2002) and Schaefer (2008) found that his raters had unique bias patterns; some were harsh on certain criteria and lenient on others. By analysing the perceptions and ratings of the same 18 raters from his previous study (2008), he found a strong positive correlation between raters’ perception of criterion importance and their bias towards that criterion when rating written work on his latter study. The more important a rater perceived a criterion to be, the more likely the rater would show a severe bias towards that criterion when rating, and vice versa. This, he argues, is a valid explanation of the bias patterns found in Schaefer’s (2008) study, and indeed Kondo-Brown’s (2002) and Wigglesworth’s (1993). However, one wonders what effect a four-year gap between the two studies may have had on the results. Raters may change their perception of what criteria is more (or less) important as they acquire more experience and/or training.
In a similar manner to Connor-Linton (1995b) and Shi (2001) (section 3.2), Lee (2009) wanted to investigate the extent to which the two groups (NES and NNS) differed in their analytic ratings of 420 written scripts, what features of the analytic scale each group believed to be the most important (in rank order), and what features of the scale were most difficult to score. Her study, however, utilised the MFRA and was more of a bias analysis study. All the scripts were written by Korean university students who were given 25 minutes to complete the task.
Like Shi (2001), the majority of the 10 raters (5 NES and 5 NNS) were co-workers who had adequate teaching experience (minimum of 2 years). All the NES held Masters degrees, while the NNS held PhD’s. They were asked to rate the scripts using a 6-point analytic scale with five features/criteria (content, organization, vocabulary, sentence structure and grammar, and mechanics). They were then asked to assign a holistic score to each script using a 6-point scale (with no mention of any descriptors). They were also given a questionnaire which asked them to rank the features of the analytic scale which they believed were the most difficult to score and those they believed the least/most important. All 10 raters underwent sufficient training sessions to help familiarize themselves with the analytic scale and scoring procedure.
Lee (2009) found, through the use of SPSS to run a reliability test, that both groups had similar reliability coefficients; the NES had (.78) whereas the NNS had (.73). Lee then used a FACETS item measurement for each group’s scores and found that NES were generally more tolerant of language accuracy errors. This was in line with previous findings (Hughes and Lascaratou, 1982; Davies, 1983; Sheory, 1986; Santos, 1988; Hyland and Anan, 2006). Furthermore, Lee, like Shi (2001), found that Korean NNS rated organization most severely. Moreover, NES were found to measure content and overall features (the holistic score) significantly more severely than the NNS. Scoring grammar, sentence structure, and organization revealed NES being significantly (p < .05) less severe than the NNS.
With regards to the difficulty each group had in scoring the five features of the analytic scale, the NES were unanimous in their belief that “content” was the most difficult criterion to score. The NNS, however, were not in agreement as two of the group believed “content” and two believed “grammar” to be the most difficult to score. Kobayashi (1992) also found that NNS had difficulty scoring ‘grammar’. Moreover, four NES believed “organization” was the second most difficult criterion to score, yet three NNS perceived it to be the easiest. Finally, when reporting what each group found the least/most important criterion on the analytic scale, four NES believed “content” to be the most important feature. Three NNS also ranked “content” as the most important. Furthermore, four NES ranked “organization” as the second most important feature, whereas the NNS ranked “content”, “organization”, and “grammar” as the second most important feature. This confirms Lee’s (2009) previous finding and indeed the finding of many other researchers that NNS place more emphasis on language accuracy when scoring written work.
The two groups did, however, agree that “vocabulary” was the least important feature of the analytic scale. These findings could be related to that of Ecks (2012), who found that raters displayed biases towards the criteria they felt were the most important (see section 3.3.4). One of the limitations of Lee’s (2009) study, as acknowledged by Lee himself, was the fact that the small number of raters did not allow him to generalize his findings. Lee also believed that the chosen topic for the students (relationships between Korea and neighbouring countries) was too emotional and as a result hindered their true writing abilities. One limitation that Lee failed to acknowledge
was the qualifications of his NNS raters. Unless the majority of Korean EFL teachers at Korean universities hold PhD degrees, the chosen group of NNS raters were not a representative sample of the general population. This compelled me to choose NNS who I believe represent the majority of NNS EFL teachers at Kuwaiti high schools in this investigation.
Hamp-Lyons and Davies (2008) attempted to establish the influence raters’ language background and language distance effect had on their evaluation of writing. The raters in their study scored 60 written scripts from the Michigan English Language Assessment Battery (MELAB), written by NES students along with students of Arab, Bahasa, Indonesian, Malay, Chinese, Japanese, Tamli and Yoruba backgrounds. However, they acknowledged that owing to a number of intervening variables, such as trained and untrained raters, various reliability levels, failure to use only one rating scale, uncertainty of some raters’/students L1, etc., along with a limited data set, few conclusions could be drawn from their study (ibid, 2008, p.36). Nevertheless, they were optimistic that their study would provide a blueprint for future investigations.
Johnson and Lim (2009) tried to overcome the aforementioned limitations of Hamp-Lyons and Davies (2008) in their study by using a much larger number of written compositions from the MELAB as well, and by having them rated by professional MELAB raters from various language backgrounds (12 NES, 2 Spanish, 1 Filipino-Amoy, 1 Filipino-Tagalog, and 1 Korean). The problem here, I believe, is twofold: (a) the rather small number of NNS raters (5 raters; 2 Spanish, 2 Filipino and 1 Korean), and (b) their proficiency level and professional expertise. Regarding the first point, findings that are a result of such a small and limited number of NNS raters cannot be safely generalized, especially considering their various backgrounds. Even though Johnson and Lim (2009) pointed out that one of the limitations of Hamp-Lyons and Davies’ study was the small number of NNS, they did little in their research to overcome this limitation. As for the second point, raters who were trained and certified with that level of English proficiency (described as having ‘native or native-like proficiency’ (ibid, p. 492)), and with an average of 5 years of rating the MELAB writing component, are not representative of the general population of NNS raters. Thus, generalizing findings from this study, as with Hamp Lyons and Davies (2008), must be done with caution. It is unclear whether the findings would carry over to other NNS raters from the same background, let alone NNS raters from other language backgrounds.
In their results, they found that the bulk of the raters’ scores were clustered near the average, and only one of the rater’s scores was more than two standard deviations away from the average. All the raters were found to be consistent and utilized all parts of the rating scale. Furthermore, NNS raters generally did not display any significant bias for or against any script written by students who share their L1. There were a few non-significant bias interactions between the NNS and scripts written by students of other language backgrounds. For example, one of the NNS (Korean) displayed a slight bias for scripts written by Chinese, Farsi and Portuguese students, yet (s)he showed some bias against scripts written by German students (ibid, p.497). However, Johnson and Lim did not find any discernible rater bias pattern pertinent to their L1.
Considering the MELAB uses a holistic rating scale, Johnson and Kim (2009) pose the question of whether a rater language background effect could be detected if an analytic scale was used. Having various components identified and rated separately requires greater and subtler distinctions, and thus a greater chance of rater variation (ibid: 502). This is one of the main reasons I decided to use an analytic scale in my investigation.
A similar study to that of Johnson and Lim (2009) was conducted by Kim and Gennaro (2012). They included a larger number of raters who were NNS (9 participants), and analysed and compared them to the ratings of 8 NES to overcome Johnson and Lim’s (2009) limitation (see previous section). They also sought to establish whether there was any bias interaction between raters and examinees (rater x examinees), and between raters and category (i.e., rater x category/criteria of the analytic scale). Although most of the raters had limited teaching experience, all of them were highly proficient (they scored higher than 102 on the TOEFL Internet Based Test). The written scripts that were used in this study were students’ writing from a university placement test. Examinees from various backgrounds were given 25 minutes to complete the task (timed essay) by hand and in pencil, on a compare and contrast prompt. Raters were trained to use a 6-point analytic rating scale that consisted of 4 criteria (Content, Organization, Grammar, and Vocabulary) to score the scripts.
They found that although the most severe rater was a NES, the NNS as a group were more severe than the NES. Of the 8 most severe raters, 6 were NNS and 2 were NES. In addition, the NNS varied more in their severity than the NES. Furthermore, both NES and NNS had a very high overall reliability coefficient, with the NNS slightly more reliable (.92 and .95 respectively). This clearly demonstrates what researchers warn against; high inter-rater reliabilities could mask rater severity (Bond and Fox, 2007; Eckes, 2011; McNamara, 1996). Regarding rater x examinee bias, they found a few cases of bias interaction, the majority of which were by NNS. The clearest systematic bias interaction found was that between Asian raters and scripts written by Asian examinees. Kim and Gennaro argue that there may be certain features of writing that Asian NNS can relate to, perhaps even subconsciously, more than other raters. As a result, Asian raters’ evaluations were influenced. They suggest further ‘in-depth qualitative research’ be conducted in the future (p.336). On the subject of rater x category (criteria of the analytic scale), once again a few interactions were found, nearly all of which were by NNS. Most these interactions, moreover, were cases of severe systematic bias.
The categories for Grammar and Content had the most bias interactions, with NNS systematically scoring these categories more harshly than expected. The category Vocabulary, however, showed the least amount of bias. While Kim and Gennaro (2012) highlighted the shortcomings of Johnson and Lim (2009), they failed to overcome them. Their data set was rather small (only 9 NES raters) and, thus, generalizing such findings should be questionable. Additionally, similar to Johnson and Lim (2009), the NNS in Kim and Gennaro’s study were also from various backgrounds (3 Korea, 3 Taiwan, 1 Brazil, 1 Poland, and 1 Mexico). It remains doubtful that the findings of this study can be generalized to a larger population of the same background.
Another limitation of this study was the fact that raters scored handwritten scripts. This has shown to be a variable that can influence raters’ evaluations, i.e., rater variation (Weigle, 2002). Neat and tidy handwriting tends to receive higher scores according to the literature (Shaw and Weir, 2007, p.176). It would have been preferable to control such a variable by typing out the written scripts and having raters score the printed versions (see Song and Caruso, 1996). Finally, the raters used in this study were all Teaching English to Speakers of Other Languages (TESOL) and were students with little or no teaching (or rating) experience. The literature has shown that experience is a factor that contributes to sizeable differences between raters (Barkaoui, 2011; Kobayashi and Rinnert, 1996; Santos, 1988).
Perhaps the closest empirical MFRM study conducted to the context of Kuwait was that of Saeidi, Yousefi, and Baghayei (2013). They investigated the rating behaviour of six Iranian teachers of English as a foreign language who were trained to rate university students’ written essays. They included 6 raters who rated 32 narrative essays using an analytic scale with seven criteria. They sought to establish to what extent their raters varied in severity degrees; whether there was an interaction between raters and test-takers; whether there was an interaction between raters and the seven criteria of the analytic scale; and whether there was an interaction between raters, tests takers and criteria. They found that their six raters had acceptable ‘fit statistics’, meaning they were all internally consistent. The criterion ‘Formal register’ (the appropriate use of discourse markers of formal register) was the easiest criterion to score by their raters, and ‘Vocabulary’ was the most difficult. As for their main research questions, they found that: (1) their trained raters significantly differed in their severity degrees, (2) there were 24 cases of significant bias interaction between rater and test-taker (examinee), (3) there were 13 cases of significant bias interactions between raters and criteria, and (4) there were no general systematic and significant bias interactions between rater, examinee (test-taker), and criteria. They observed, like Kondo-Brown (2002) and
Schaefer (2008), that there were some significant bias interactions with examinees (test-takers) with extremely higher or lower abilities.
This investigation, as in the majority of the previous ones involving NNS, had a very small number of participants. The analytic rating scale used also proved problematic. Even though the rating scale diagnostic report, produced by the MFRM, showed that the scale was functioning well, the different number of scores on each criterion was somewhat confusing. Some criteria had four levels (Mechanics, Content, Use, and Organization), some three (Vocabulary, register, and Fluency). What caused even more confusion was that some of the criteria with four levels had the scores 0, 1, 2 and 3(Mechanics, Organization, and Use), whereas another had the scores 1, 2, 3 and 4 (Content). Similarly, on the criteria with three levels, the criterion Vocabulary had scores of 1, 2 and 3 whereas
Register and Fluency had 0, 1 and 2. Bearing in mind that they had adapted the scale, I believe it would have been prudent to make the scores more consistent, i.e. 0, 1, 2 and 3 or 1, 2, 3 and, 4. Moreover, it would have been beneficial if they had adopted a mixed methods approach and had interviewed some of the raters to further investigate the significant differences they found. All the main findings from the empirical MFRM studies in this section (3.3) are summarized below:
• Raters significantly vary in their severity degrees.
• Raters may have consistent, systematic severe or lenient biases towards aspects other than language performance when scoring written work.
• Raters may be consistently biased when rating certain features of writing commonly found on the analytic scale, for example, ‘grammar’.
• Raters may be consistently biased when rating scripts written by certain groups of candidates (test-takers), for example, scripts written by candidates who share the raters’ L1.
• Raters often have unique bias patterns, which are usually very complicated, in relation to candidate (test-taker) and category (criteria) when scoring writing.
• Raters sometimes exhibit biases with students of higher or lower abilities.
• NES and NNS did not significantly differ in their evaluations and had high reliability coefficients.
• NES were slightly more lenient raters.
• NES displayed more clear biases in their ratings than NNS.
3.4 Qualitative studies of rater variance: The decision-making process.
In order to better understand matters pertinent to rater variation, a number of studies have adopted a more qualitative approach. These studies typically utilize introspective and retrospective methods, particularly verbal protocols, to explore the decision making behaviours or strategies of raters when rating written compositions. Some of these studies analysed how experienced and novice raters differ in their decision-making behaviour. On the whole, these studies demonstrate that there is a significant difference in the decision-making processes between the two groups (Barkaoui, 2010; Cumming, 1990; Hout, 1993; Wolfe, 1997; Wolfe et al., 1998). Cumming (1990), for instance, found that raters’ decision-making strategies when rating written work using a holistic scale involved extremely interactive and complex cognitive processes. He identified 28 decision-making strategies, many of which significantly differed in use between the experienced and novice raters. According to Cumming, the experienced raters (teachers) exhibited a much more thorough mental representation of the task, utilized a greater number of rating criteria, and had better self-monitoring strategies (i.e., controlling their rating behaviour). The novice raters, on the other hand, used fewer criteria to assess the written compositions and depended heavily on their reading abilities or other skills they had acquired, like editing. Similar results were also found by Hout (1993), who also used a holistic rating scale. Despite both groups (experienced and novice) focusing on similar criteria, the expert raters provided a larger and more varied number of comments. In addition, it was observed that the novice raters were more personally engaged in the scripts being rated. Furthermore, Wolfe et al. (1998) and Wolfe (1997) corroborated these findings. Barkaoui (2010) also compared how expert and novice raters score scripts using both holistic and analytic rating scales and found that the scale had a larger influence on the decision-making behaviour of raters than experience. He suggests that analytic scoring is more suitable for novice raters as it focuses their attention on the rating criteria and reduces the demanding cognitive process of weighting the criteria and arriving at a single holistic score.
Other qualitative studies analysed the decision-making processes of raters and attempted to categorise them in defined groups. Vaughan (1991), for example, adopted a think-aloud protocol with nine experienced raters who scored six essays using a six-point holistic scale. She identified the following five approaches (or reading styles):
• The single focus approach, which mainly focuses on a single aspect, like the decision to pass/fail.
• The first impression dominates approach, which heavily relies on raters’ intuitive first impression of the script.
• The two-category approach (strategy), which focuses mainly on only two writing criteria.
• The grammar-oriented approach, which focuses mainly on the grammatical criterion.
• The laughing rater, who tends to rate affectively.
Vaughan also noted that raters adopt the ‘first impression approach’, the ‘grammar-oriented approach’, and the ‘two-category approach’ when none of the descriptors adequately describe the script. In such circumstances, according to Vaughan, raters tended to base their ratings on aspects that were sometimes unrelated to the criteria of the rating scale and training they received. However, it is very likely that this is due to the holistic scale used in her study (see Barkaoui, 2010). She concluded that her raters focus on different writing criteria, even though they had similar training and expertise. Drawing on the work of Cumming (1990), Milanovic, Saville and Shen (1996) adopted various qualitative methods (i.e., introspective verbal reports, retrospective written reports, group interviews) to devise a model of rater decision-making behaviour (approach) in holistic ratings. They identified the following four approaches:
• The principled two-scan/read approach.
• The pragmatic two-scan/read approach.
• The read through approach.
• The provisional mark approach.
Milanovic et al. (1996) also created a list of eleven features of writing that raters focus on the most in verbal reports. These features are: length, legibility, grammar, structure, communicative effectiveness, tone, vocabulary, spelling, content, task realization, and punctuation. It is obvious that the majority of these are features at the sentence level (micro-features of writing). Moreover, they observed that raters varied significantly in the weight they attach to each of the eleven aforementioned features. They noticed, for instance, that punctuation was not weighted as heavily as the other features. This observation of varying weight attachment to different criteria was later corroborated by Eckes (2008, 2012) who grouped raters based on the weight they attach to various criteria. He identified six types of raters: the syntax type, the correctness type, the structure type, the fluency type, the non-fluency type, and the non-argumentation type (see section 3.3.4). Knoch (2009), however, believes that raters greatly vary in the weight they attach to criteria and that such findings are ‘inconclusive’ (p.51). Sakyi (2000) explored whether the criteria (descriptors) provided in holistic rating scales were used and followed at all. Using verbal protocols, he found that only some of his raters focused on the rating scale, and established four distinguishable styles of rating, namely focus on errors in scripts; focus on essay topic and presentation of ideas; focus on raters’ personal reactions to scripts; and focus on the scoring criteria. Moreover, those who did focus on the scoring criteria tended to focus on only one or two criteria, much like the ‘two category approach’ found in Vaughan (1991). Sakyi sums up by arguing that content factors (e.g., organization, idea development) and language factors (e.g., grammar, vocabulary) both influence raters’ general impression of the script. However, the holistic score they ultimately award based on their general impression of the script can also be influenced by their personal biases/expectations and personal monitoring factors.
As far as descriptive frameworks for rater decision-making strategies go, Cumming, Kantor and Powers (2002) have arguably produced the most comprehensive taxonomy. After undertaking a series of three studies of rater behaviour, also using verbal protocols and without the use of any rating scale, they identified 27 behaviours that one may expect from experienced raters. Unlike previous researchers, Cumming et al’s. (2002) classification of raters’ decision-making strategies was based on two dimensions: focus and strategy. Focus consisted of three subgroups: self-monitoring focus, rhetorical and ideational focus, and language focus. Strategy consisted of two subgroups: interpretation strategies and judgment strategies. Their results also show that raters tend to weight rhetoric and ideas more heavily than language when rating scripts written by more proficient writers. In addition, they found that the experienced group of ESL raters focused more on language (form and accuracy) than rhetoric and ideas, whereas the English mother-tongue group focused on both foci (rhetoric and ideas, and language) more equally. Finally, they argue that it might be wise to weight language criteria more heavily for lower ability writers and rhetoric and ideas more heavily for higher ability writers. In other words, writers (test-takers) should exhibit a certain level of language competence before raters can adequately rate their rhetoric and ideas.
Similar to Vaughan (1991), Milanovic et al. (1996), Sakyi (2000) and Cumming et al. (2002), Baker also classified raters based on their decision-making strategies. However, she turned to the field of judgment and decision making and explored the usefulness of applying Scot and Bruce’s (1995) decision making style inventory to rater decision making in writing assessment. Her study utilized retrospective write-aloud protocols and Scot and Bruce’s (1995) questionnaire to explore the possibility of creating a rater decision making strategy profile. The write-aloud protocol, Baker felt, was superior to the think-aloud protocol used in other studies (Barkaoui, 2010; Cumming etl al., 2002; Lumley, 2002; Milanovic et al., 1996) because: (a) it did not disrupt the process of rating, (b) did not require her data to be transcribed, and (c) required less participant training. Participants were asked to write down what they felt the exact moment they arrived at a score. They were also instructed not to try to write a justification for their score. Rather they were required to write down their feelings as they decided on a score, the point in time when they were reading the script that they arrived at the score, how confident they felt in the score they awarded, what they felt they may have needed to arrive at a score, and any other salient information they felt contributed to their decision-making. The general decision-making style inventory by Scot and Bruce consists of five different styles as follows (Baker, 2012, p.227):
• Rational: preference for the systematic collection, evaluation, or weighing of information.
• Intuitive: preference for relying on feelings, hunches, and impressions that cannot be put into words when making decisions.
• Dependent: preference for drawing on the opinion or support of others; on receiving
second opinion or advice.
• Avoidant: preference for delaying decision-making, hesitation, or making attempts to
avoid decision making altogether.
• Spontaneous: preference for coming to a decision immediately or as early as possible.
Although she found that the majority of write-aloud comments were ‘rational’ and ‘intuitive’, she also found examples of comments for each of the aforementioned decision-making styles. Moreover, the write-aloud protocol comments showed that all her raters were ‘rational’ and ‘intuitive’. She concludes that raters’ decision-making behaviour can be influenced by textual features in each script. For example, ‘avoidant’ raters are more likely to systematically exhibit avoidant behaviour with scripts that do not fulfil the task requirements. It is clear that there is a certain amount of overlap between all the rater decision-making classifications found in this section. For instance, Vaughan’s (1991) ‘first impression dominates approach’ is almost identical to Milanovic et al’s. (1996) ‘provisional mark approach’, and Baker’s (2012) ‘spontaneous’ decision maker. Another researcher who qualitatively studied the process of rating writing from the raters’ perspective is Lumley (2002, 2005). Using think-aloud protocols, he examined how four trained raters comprehended and applied the descriptors of the rating scale when rating essays in addition to their decision-making processes. He found that raters generally followed the criteria stated in the rating scale, but, like Vaughan (1991) and Sakyi (2000), had difficulties rating scripts that they could not match with a specific descriptor. This inadequacy of the rating scale forced his raters to award ratings that were unrelated to the rating scale and the training they received.
They used their knowledge, intuition, or even weighted a specific writing criterion more heavily to resolve this conflict. Likewise, Smith (2000, cited it Barkaoui, 2010) also found that raters may attend to criteria unstated in the rating scale to arrive at a particular rating. This is especially the case when a script cannot be matched with a descriptor on a rating scale. All the studies in this section used either a verbal think-aloud protocol or a write-aloud protocol, among other techniques. These methods are not without their limitations. Verbalizing or writing one’s thought process while simultaneously performing a task may adversely influence the very process one wishes to capture (Barkaoui, 2010). For instance, the severity degree of one of Baker’s (2012) raters drastically changed as she was reflecting on her thought process. Another problem with some of the decision-making behaviour classification studies, in my opinion, is similar to the problem faced by some of Lumley’s (2002, 2005) raters when descriptors did not fully match the script being rated. These broad classifications may not fully capture something as complex as raters’ decision-making processes. That is not to say that such classifications are not useful. On the contrary, like rating scales they can serve as a useful guide to testers who wish to explore rater variance in performance-based assessment.
The main findings of the studies covered in this section are covered below:
• Experienced raters differ significantly in their decision-making processes to novice raters (Barkaoui, 2010; Cumming, 1990; Hout, 1993; Wolfe, 1997; Wolfe et al., 1998).
• Raters often refer to criteria that are unrelated to the descriptors of the analytic scale when they have trouble matching a script to a specific descriptor (Lumley, 2002, 2005; Sakyi, 2000; Smith, 2000, cited in Barkaoui, 2010; aughan, 1993).
• There is a certain degree of overlap between the classifications of rater decision-making styles/ approaches/ processes.
3.5 Sentence length in English and Arabic writing.
Some of the previous literature has suggested that raters who share students’ L1 may score their writing more favourably (Hinkel, 1994; Kim and Gennaro, 2012; Kobayashi and Rinnert, 1996; Land and Whitely, 1989). Some NNS have been found to favour certain rhetorical features, such as explicitness, specificity, support (Hinkel, 1994), or quality of content, quality of introduction (Kobayashi and Rinnert, 1996), when rating scripts written by students who share their L1. One feature of writing that has not been studied sufficiently is that of sentence length and its effect on NES and NNS perception and evaluation of writing. In his Oxford Guide to Plain English, Martin Cutts (1995) offers the following as his very first guideline on how to write: “Over the whole document, make the average sentence length 15-20 words.” (p.1). He argues that readers “recoil when they see long sentences slithering across the page towards them like a Burmese python”, and that long sentences “give the reader too much to cope with” (ibid: 1). Moreover, he argues, readers are much more accustomed to reading 15-20 words per sentence on average. Gunning and Muller (1985) also recommended that written sentences be kept short and that the longer the sentence the greater the strain on the reader. They acknowledge that long sentences may be balanced and readable, but note that only extremely proficient writers, such as Charles Dickens and Thomas Wolfe, can occasionally write clear, overly long sentences. They also note that even the likes of Dickens and Wolfe on average wrote no more than 20 words per sentence. Sanyal (2006) notes that in normal circumstance “sentence length is closely related to clarity” (ibid; p.45). Sanyal (2006, p.47-48) quotes Hungarian Mathematician George Polya who stated:
“The first rule of style is to have something to say. The second rule of style is to control yourself when, by chance, you have TWO (emphasis in original) things to say; first one, then the other, not BOTH (emphasis in original) at the same time”.
Moreover, examination of literature from the sixteenth century to the modern day has shown that, year by year, English sentences are getting shorter (Sonyal, 2006). More interestingly, Sonyal (2006) notes that over 135 years ago, Frenchman Gustavo Flaubert, who was acknowledged in Europe as the master of prose style said:
“Whenever you can shorten a sentence, do. And one always can. The best sentence? The shortest” (cited in Sonyal, 2006, p. 50).
Instructions to keep sentences shorter on average are found in areas other than writing classrooms. Evans (1972), for instance, instructs newsmen to keep sentences short on average. He argues that longer, more complex sentences contain too many ideas which can confuse readers. Similar advice is given by Gunning and Kallan (1994) to business writers. Sentence length is also one of the main parameters of various automated writing measurement tools. For example, readability formulas, like the Flesch Reading Ease formula, the Flesch-Kincaid Grade Level formula, and the Coh-Metrix Readability formula (see Coh-Metrix (2011) for details about each formula), all measure sentence length on average before giving an automated Readability score for a written script. Furthermore, Syntactic Simplicity: “the degree to which the sentences in the text contain fewer words and use simpler, familiar syntactic structures, which are less challenging to process” (Coh-Metrix, 2011), is another automated writing measurement that also takes into account the average length of sentences. In fact, the average length of sentences and Syntactic Simplicity scores are very highly correlated (Coh-Metrix, 2010).
Contrary to English sentences, Arabic sentences are much longer on average and more syntactically complex. The average Arabic sentence ranges from 20-30 words per sentence and it is not uncommon to exceed 100 (Al-Taani et. al., 2012). Plus, Mohammed (2005) noted that Arabic sentences contain many more clauses than found in English ones; the Arabic sentence contains an average of 7.25 clauses whereas the English sentence averages 2.3 clauses. Thus, identifying sentence structure in Arabic is a difficult task (Al-Taani et. al., 2012). Also, Arabic sentences are more complex and syntactically ambiguous since sentences have free word order (ibid: 2012), and contain so many clauses (Mohammed, 2005).
Another way in which the two languages differ is that Arabic writing is phonic, that is, words are spelt exactly as they are pronounced. English, on the other hand, is non phonemic in its spelling structure. Arabic is written from right to left and has less rigid punctuation rules than English (Mohammed and Omer, 1999). Another difference between the written forms of the two languages is the orthography. Whereas the orthography of the English sentence is easily defined by an initial capital letter and a full stop (period, exclamation point, question mark), the orthographic structures in Arabic are not so singular. While both Arabic and English use a full stop to signal the end of a sentence, Arabic can also use double dots (..) and triple dots (…) to signal this same purpose. For example, Mohamed and Omer (1999) found that nearly half of the Arabic sentences in students’ compositions replaced the English full stop with double dots. Additionally, a comma in Arabic writing can also signal the end of a sentence. For example, Mohammed (2005) found many cases where Arab learners had used a comma in place of a full stop when writing in English. In addition, question marks and exclamation marks do not always signal the end of a sentence in Arabic and students sometimes use both a question mark and an exclamation mark along with a full stop (Mohammed and Omer, 1999).
Yet there is a finer distinction between the full stop, double dots and triple dots in Arabic. The full stop indicates that a sentence has ended both linguistically and pragmatically (Mohammed, 2005). The double or triple dots are used to indicate that the sentence may have ended linguistically, but has not ended pragmatically (Mohammed, 2005). Readers are left with the task of inferring or guessing that which has not been expressed through contextual clues. There seems to be a lot more responsibility on the readers’ shoulders in Arabic than in English (Mohammed and Omer, 2000). Another major difference between Arabic and English writing is the concept of ‘sentence completeness’. Arabic sentences are based on pragmatic, rather than semantic, completeness and propositional completeness is not the basis of Arabic sentences (Mohammed, 2005; Mohammed and Omer, 1999). Mohammed (2005) points out that the “complete propositions which are encoded in several English sentences are often encoded in a single Arabic sentence” (p.9). It is only when the external, non-linguistic context which the sentences are describing are complete and independent, relatively that is, that an Arabic sentence ends (Mohammed and Omer, 1999). In other words, a pragmatic scene is realized in each sentence in Arabic. Thus, Mohammed and Omer (1999) argue that sentences in Arabic should be regarded as a discourse unit rather than a syntactic one. The main differences between English sentences and Arabic sentences are summarized in table 3.1.

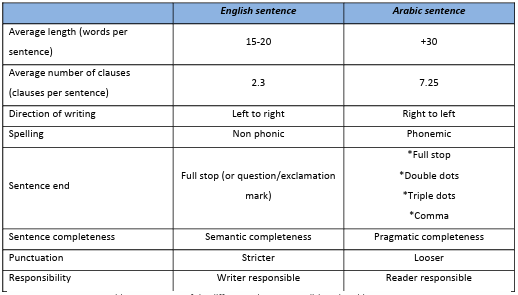
In Arab countries, students are required to learn Arabic from a very early age, usually at kindergarten. Reading, writing, vocabulary and grammar are the main foci of teaching and assessment in Arabic classes (Gebril and Taha-Thomure, 2014). Gebril and Taha-Thomure (2014) also state that much emphasis is paid to grammar by Arabs due to the complex nature of the Arabic language and the grammar-centred teaching methodology used in the Arab world (p.5). Nearly 50 years ago, Kaplan (1966) noted that speakers of Arabic transfer their L1 rhetorical patterns to English when writing. Later studies confirmed this (Noor, 1996; Kambal, 1980). A number of studies have observed that syntactic errors are the main type of errors committed by Arab students when writing in English (Al-Khresha, 2011; Noor, 1996; Javid and Umer, 2014; Kambal, 1980; Kharma and Hajjaj, 1997; Tahaineh, 2010), and that these errors are largely a result of L1 transfer (Noor, 1996). Noor (1996) analyzed the syntactic errors in a number of studies of Arab students’ writing in English as a Second Language (ESL) and English as a Foreign Language (EFL) and arranged them under seven categories: (1) Verbal, (2) Preposition, (3) Relative clause, (4) Conjunction, (5) Adverbial clause, (6) Articles, and (7) Sentence structure. Punctuation and grammar were also found to be major areas of weakness in Arab students’ writing of English (Al-Khasawneh, 2010; Hisham, 2008; Javid and Umer, 2014; Tahaineh, 2010), along with ‘coherence and cohesion’ (Khuwaileh and Al-Shoumali, 2010). In addition, Arab students also believed, according to Al-Khasawneh (2010), that the biggest obstacles they faced when writing in English were lexical and grammatical in nature.
None of the studies that analyzed Arab students’ problems in writing English included their written scripts in full. They appear only to analyze erroneous sentences, much like the studies in section 3.1. During my time as a teacher, I observed that many Arab students produce overly long sentences in their written work. This, I presumed, was a subtle case of L1 transfer. Even though it is established that Arabic sentences are longer on average than their English counterparts (Mohammed and Omer, 1999; Tahaineh, 2010), there is a dearth of literature analyzing the influence this has on Arab students’ writing in English. Even more scarce are studies showing the possible effect such long sentences may have on NES or NNS.
Khawaileh (1995) observes that Arab students’ writing in English can cause serious confusion to NES. If Arab students are transferring the sentence length of their L1 to English, then it stands to reason that this, along with the other negative forms of L1 transfer discussed above, may contribute to the aforementioned confusion. Moreover, if Arab students are transferring long sentence length to their English written work, then perhaps this may explain the assertion that syntactic errors are the most prominent errors in their writing in English (Noor, 1996; Javid and Umer, 2014). Do Arab students produce sentences that are longer than average when writing in ESL/EFL? If so does this result in better or poorer writing? Do NES and NNS teachers perceive longer than average sentences in written work similarly? Do longer than average sentences result in more syntactic/grammatical errors? If so, what influence does syntactic simplicity have on raters (NES and NNS)? These are some of the questions pertinent to the average length of sentence in Arab students’ ESL/EFL writing that the literature has yet to shed light on.
3.6 Summary of the major findings in Chapter 3.
A summary of all the major findings in the studies covered in Chapter 3 is presented in table 3.2.
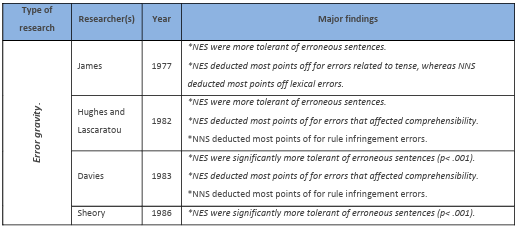

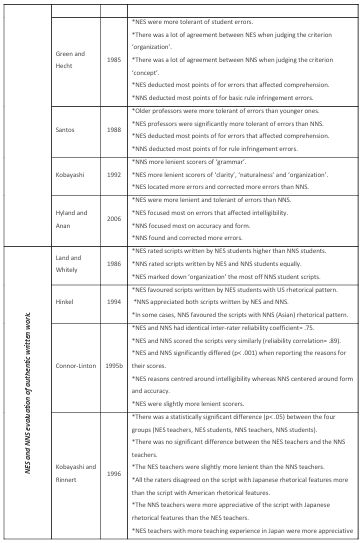

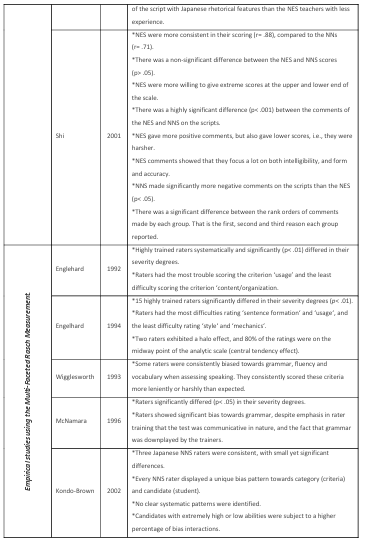

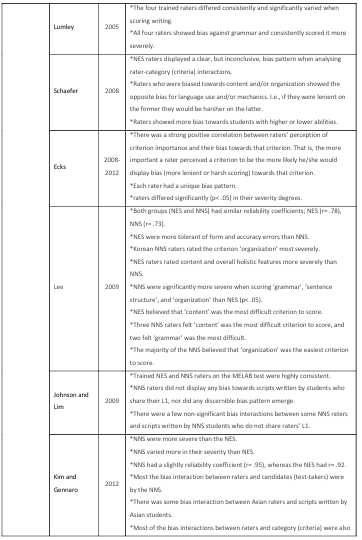


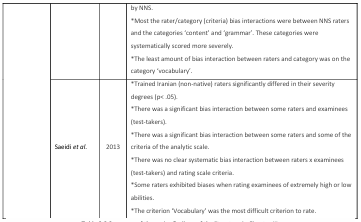
3.7 Chapter 3 summary.
Raters’ L1 has been found to be an experiential factor that results in rater variance and a good number of studies have explored how it may influence the process of rating written work. Much of the earlier literature compared how NES and NNS perceived errors in de-contextualized erroneous sentences or errors in authentic written texts, where participants were asked to locate and rate the errors in term of severity. Later studies compared the two groups’ evaluation of writing using a holistic or analytic rating scale and analysed what features each group liked about the written scripts. Some compared the rhetorical features of writing that each group favoured and what criteria they felt were the most important in writing. Others compared the qualitative reasons each group reported and explained the reasons they awarded them such scores.
Furthermore, other studies shed light on how raters can be biased towards aspects other than language performance when scoring spoken or written work. These biases are, naturally, a serious threat to scoring validity and a major argument against Claim 4 of the AUA as they may favour one type of test-taker over another (Crusan, 2010). The most common types of bias analysis studies are those that have set out to explore the bias interaction between raters and specific linguistic criteria and their biases towards (or against) certain candidates (test-takers). In most academic settings in Kuwait, and indeed around the globe, the burden of scoring written work falls squarely on the teachers’ shoulders. Some of the studies covered in this chapter compared NES non-teachers to NNS non-teachers (Hinkel, 1994; Land and Whitley, 1986), whereas others compared teachers in training or teachers with very limited teaching experience (Connor-Linton, 1995b; Kobayashi and Rinnert, 1996; Shi, 2001). Moreover, many of the studies either did not use any form of rating scale (Hinkel, 1994) or scales with no explicit descriptors (Shi, 2001). Some of those who did use rating scales with descriptors chose holistic scales (Hamp-Lyons and Davies, 2008; Johnson and Lim, 2009), as opposed to an analytic scale, which is more suited for NNS test-takers (Weigle, 2002). Moreover, some of the literature did not produce results that could be generalized owing to the insufficient number of NNS raters (Hamp-Lyons, 2008; Johnson and Lim, 2009; Kim and Gennaro, 2012; Kondo-Brown, 2002 Lee, 2009) or the use of manipulated data (Kobayashi and Rinnert, 1996).
In addition, of the few studies that did compare NES and NNS teachers’ evaluation of writing, none compared NES to Arab NNS. Of the NNS backgrounds covered in these studies, some were East Asian (Connor-Linton, 1995b; Hinkel, 1994; Johnson and Lim, 2009; Kim and Gennaro, 2012; Kobayashi and Rinnert, 1996; Kondo-Brown, 2002; Lee, 2009; Shi, 2001), Spanish (Johnson and Lim, 2009), German (Green and Hetch, 1985), Brazilian, Polish and Mexican (Kim and Gennaro, 2012). Gebril and Hozayin (2014) state that very few language testing/assessment investigations have been carried out in the Arab world. This investigation has been undertaken with the goal of adding to our understanding of Arab raters.
One of the characteristics of the Arabic sentence is its length. Arabic sentences are generally much longer than English sentences. It has not yet been established whether this transfers when Arab students produce written work in English. Also, it has yet to be established how NES teachers and Arab NNS would perceive and evaluate longer than average sentences in English writing. This investigation sets out to establish the influence raters’ L1 (NES and Arab NNS), along with the effect of average length of sentences (short and long), has on rater variance. It will analyse how each group (NES and Arab NNS) scored two types of scripts: scripts with short sentences on average and scripts with long sentences on average using an analytic scale. A large number of participants will be used in this investigation to overcome previous limitations (e.g., Hamp-Lyons and Davies, 2008, Johnson and Lim, 2009, Kim and Gennaro, 2012; Kondo-Brown, 2002), to ensure the results can be generalized. Moreover, Arab NNS will be used for the first time and compared to NES. It is hoped that this investigation will contribute to a scoring validity argument, as well as to the process of identifying factors that may contribute to rater variation in the assessment of timed essays. The next chapter will cover the research questions along with methodological issues pertinent to this investigation.
Chapter IV
Methodology
This chapter begins by outlining the mixed methods research design employed (section 4.1). The research questions and hypotheses are then restated (section 4.2). This is followed by a detailed description of the research participants and setting (section 4.3). The four instruments used for this study – the written scripts, the analytic rating scale, the instructions, and the Coh-Metrix tool – will be covered in section 4.4. The procedure (section 4.5) includes data collection and the coding of the data (interviews) followed by analysis of the statistical tests used. Details relevant to the pilot study follow (section 4.6) and ethical issues will be covered (section 4.7). Finally, a summary of the chapter is presented (section 4.8).
4.1. Research design.
In this investigation, a mixed method research was employed where I “combine elements of qualitative and quantitative research approaches for the broad purposes of breadth and depth of understanding and corroboration” (Johnson et al., 2007, p.123). Mixed methods research has grown rapidly over the last decade in social and behavioural sciences as well as in the field of language testing (Brown, 2014, 2015; Turner, 2014). This approach, I believed, would afford numerous advantages compared to a qualitative or quantitative approach alone. Firstly, scoring written work is a very complex process (McNamara, 2000; Weigle, 2002), and using the mixed methods approach would allow for a greater understanding of how NES and NNS score written work by combining the raw scores awarded to the scripts using the analytic scale (quantitative), with an analysis of what raters had to say in the interviews that followed (qualitative). In other words, it verifies the quantitative findings against the qualitative (Dörnyei, 2007). As a result, we gain a “valuable insight into and deeper understanding of complex phenomena under study” (Turner, 2014, p.4).
Another advantage the mixed method approach has is that it compensates the weaknesses of one approach with the strengths of the other by reducing the biases of using a monomethod approach (i.e., qualitative or quantitative). So, while the raw scores awarded to each script by the raters may reveal how NES and NNS differ when scoring scripts using an analytic scale, the retrospective interviews offer a greater understanding as to why they differ and whether sentence length had influenced their scores. This triangulation results in more valid and reliable findings (Dörnyei, 2007; Johnson and Onwuegbuzie, 2004).
Moreover, Van Moere (2014) argues that in studies pertinent to rater variation it is not “enough to show that there is a difference between raters with different characteristics.. we want to understand raters’ decision making in the context of all the other test variables” (ibid: p.14). The mixed method approach allows us to corroborate the findings of this investigation through triangulation (Dörnyei, 2007).
4.2. Research Questions and hypotheses.
The research questions together with the corresponding research hypotheses are:
Research question 1: Is there a significant difference (p < .05) in the overall degree of severity of raters who scored the scripts using the analytic scale?
H0 There is no significant difference (p> .05) in the overall degree of severity of raters who scored the scripts using the analytic scale.
H1 There is a significant difference (p< .05) in the overall degree of severity of raters who scored the scripts using the analytic scale.
The MFRM Rater Measurement report will be presented to investigate the overall degree of severity exhibited by each rater. The reliability index (not the traditional reliability estimates, but rather the measure of the extent to which raters really differed in their level of severity)- that it, the percentage of exact agreement between raters along with the p value will be reported in full. High reliability estimates (> .80) and a p < .05 indicate that raters differed significantly in their overall severity.
This research question will then be broken down into two sub-questions to analyse how each group functioned in isolation. The two sub-questions with their respective hypotheses are:
Research question 1.1: Is there a significant difference (p< .05) in the overall degree of severity of the NES who scored the scripts using the analytic scale?
H0 There is no significant difference (p> .05) in the overall degree of severity of NES who scored the scripts using the analytic scale.
H1 There is a significant difference (p< .05) in the overall degree of severity of NES who scored the scripts using the analytic scale
Research question 1.2: Is there a significant difference (p < .05) in the overall degree of severity of the NNS who scored the scripts using the analytic scale?
H0 There is no significant difference (p > .05) in the overall degree of severity of NNS who scored the scripts using the analytic scale.
H1 There is a significant difference (p < .05) in the overall degree of severity of NNS who scored the scripts using the analytic scale.
Research question 2: Is there a significant bias interaction (t> +/-2) between raters and scripts?
H0 There is no significant bias interaction (t< +/-2) between raters and scripts.
H1 There is a significant bias interaction (t> +/-2) between raters and scripts
The total number of statistically significant bias terms (t> +/-2) (rater x script) will first be reported (Eckes, 2010). These bias terms will then be divided into two groups: overestimations (systematically more lenient scores) and underestimations (systematically more severe scores). Then each group will be analysed to determine which rater group (NES and NNS) overestimated (and underestimated) which script type (short sentences and long sentences). Finally, pairwise comparisons of raters who significantly differed (t> 2) in their ratings of the same script will be presented.
Research question 3: Is there a significant bias interaction (t> 2) between raters and criteria?
H0 There is no significant bias interaction (t< 2) between raters and criteria.
H1 There is a significant bias interaction (t> 2) between raters and criteria.
Similar to the previous research question, the total number of statistically significant bias terms (t> 2) (rater x criteria) will be reported first. These bias terms will then be separated into two groups; overestimations (systematically more lenient scores) and underestimations (systematically more severe scores). Then each group will be analysed to determine which rater group (NES and NNS) overestimated (and underestimated) on which criteria (Task achievement, Coherence and cohesion, Lexical resource, and Grammatical range and accuracy). Finally, pairwise comparisons of raters who significantly differed (t> 2) in their ratings on each criterion will be presented.
Research question 4: Is there a significant bias interaction (t> 2) between raters, scripts, and criteria?
H0 There is no significant bias interaction (t< 2) between raters, scripts, and criteria.
H1 There is a significant bias interaction (t> 2) between raters, scripts, and criteria.
This research question will be broken down into four sub-questions matching the criteria of the analytic scale (Task achievement, Coherence and cohesion, Lexical resource, Grammatical range and accuracy). Each sub-question will present the statistically significant bias terms of (rater x script x criteria) (t> 2). The four sub-questions with their corresponding hypotheses are presented below.
Research question 4.1: Is there a significant bias interaction (t> 2) between raters, scripts, and Task
achievement?
H0 There is no significant bias interaction (t< 2) between raters, scripts, and Task achievement.
H1 There is a significant bias interaction (t> 2) between raters, scripts, and Task achievement.
Research question 4.2: Is there a significant bias interaction (t> 2) between raters, scripts, and
Coherence and cohesion?
H0 There is no significant bias interaction (t< 2) between raters, scripts, and Coherence and cohesion.
H1 There is a significant bias interaction (t> 2) between raters, scripts, and Coherence and cohesion
Research question 4.3: Is there a significant bias interaction (t> 2) between raters, scripts, and Lexical resource?
H0 There is no significant bias interaction (t< 2) between raters, scripts, and Lexical resource.
H1 There is a significant bias interaction (t> 2) between raters, scripts, and Lexical resource
Research question 4.4: Is there a significant bias interaction (t> 2) between raters, scripts and Grammatical range and accuracy?
H0 There is no significant bias interaction (t< 2) between raters, scripts and Grammatical range and accuracy.
H1 There is a significant bias interaction (t> 2) between raters, scripts and Grammatical range and accuracy.
4.3 Participants and setting.
This section presents a brief overview of the research participants and setting followed by an in depth look at the two groups, the Native English Speakers (NES) and the Non-native Speakers (NNS).
4.3.1 Participants and setting overview.
Sixty teachers of English as a Foreign Language (EFL) comprising 30 native speakers (NES) and 30 non-native speakers (NNS), all of whom were working in various educational institutes in Kuwait, took part in this investigation. All the participants (raters) were given an information letter and consent form to sign (Appendix 1), a questionnaire regarding their teaching background (Appendix 2), an analytic rating scale (see Appendix 3), the 24 written scripts (Appendices 7-30) which were presented in random order and a task sheet with instructions on how to score the scripts using the analytic scale. Then after that another 14 participants took part in the second set of interviews (10 NNS and four NES).
In order to diminish the influence suggested in the literature that experience may have on assessing written work (Santos, 1988; Weigle, 1999), teachers with fewer than 5 years of teaching experience in Kuwait were not included. This was a more experienced group, in so far as teaching goes, than Shi’s (2000). Santos (1988) found that raters with more than five years of experience tended to be more consistent in their marking than those with fewer than five. However, it is worth noting that experience in teaching and experience in scoring/assessment are two different things. While it is reasonable to assume that they are highly correlated, that is, the more they teach the more likely they are to assess, it is also conceivable that years of teaching does not mean equal years of scoring work. Weigle (2002) states that numerous teachers have little to no rating experience and have never undergone any language testing and assessment courses throughout their academic careers, let alone rater training. However, all of the raters in this investigation claimed to have undertaken at least one course in language testing and assessment, but none of them had received any formal professional rater training. Moreover, the gender of raters in this investigation was not thought to be a factor that may influence the process of scoring written work as the literature suggests (Hymp Lyons, 1991). Nevertheless, the numbers of male and female raters were comparable in this investigation. Of the 60 raters, 32 were male (53%) and 28 were female (47%). Unlike Lee (2009), the raters did not undertake specific training for this investigation since rater training in general is very rare in Kuwait, and thus these raters were not trained so as to replicate the reality of rating at schools as much as possible. Moreover, the two groups seldom work collaboratively because NES are employed predominantly by private educational schools, universities and institutes, whereas NNS are employed to a greater degree in the government sector. Finally, I took Davies’ (1983) warning into account and did not include the teacher of the 24 students whose scripts were chosen for the investigation (see chapter 2), as knowledge of a student could influence the score awarded (Henning, 1987).
4.3.2 The NES participants.
The majority of the NES raters (17) were teachers at the British Council in Kuwait. The remainder worked at various private educational institutes in Kuwait, namely, the American University of Kuwait (AUK) (6 raters), the Australian College of Kuwait (ACK) (4 raters), and the America-Mideast Educational and Training Services (AMIDEAST) (3 raters). All the NES had a minimum of 5-10 years teaching experience with eleven of them having 10-15 years of teaching experience in Kuwait. Fifteen of the 30 NES raters were British, the remainder were American (7 raters), Australian (4 raters), Canadian (3 raters) and South African (1 rater). Of the 30 NES participants, 4 held a PhD, 8 held Master’s degrees (including the 4 PhD holders) and the remainder (22) held Bachelors’ degrees (including the PhD and MA holders). Furthermore, all the participants working at the British Council in Kuwait (17 NES raters) held a Certificate of English Language Teaching for Adults (CELTA), and 4 of the aforementioned 17 held a Diploma of English Language Teaching for Adults (DELTA), which is a higher certification than the CELTA. Only 2 NES raters did not hold a Bachelor’s degree, but did, however, hold a CELTA qualification. It was fortunate to find such a group with good teaching experience in Kuwait, unlike Connor-Linton’s (1995b) NES who were graduate students preparing to become English as a Second Language (ESL) teachers with little or no actual teaching experience. Twelve of the NES participants were female, whereas eighteen were male. Table 3.1 summarizes the relevant information pertinent to the NES of this investigation. Further details on the NES raters are provided in Appendix 5.
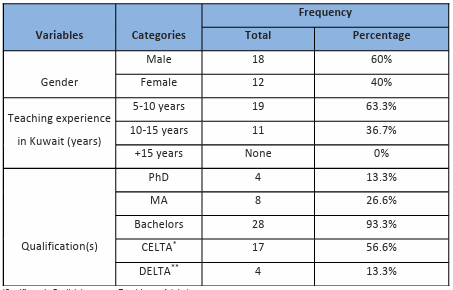

*CELTA (Certificate in English Language Teaching to Adults)
**DELTA (Diploma in English language Teaching to Adults)
Table 4.1 NES raters’ profile
4.3.3 The NNS participants.
The NNS in this investigation were a very homogenous group. They were all teachers at government high schools in Kuwait from various districts. This is the equivalent of college level in the UK educational system. Half the number of NNS raters (15) had 5-10 years of teaching experience, 14 had 10-15 years, and 1 had +15 years of experience in Kuwait. The NNS participants were Arabs from Kuwait (10 raters), Egypt (8 raters), Syria (5 raters), Jordan (3 raters), Tunisia (2 raters), and Morocco (1 rater), which I believed was a good representative sample of EFL teachers in Kuwait. One, however, was an Afghani national who was born, raised and had obtained his degree in Kuwait, and has since been teaching in Kuwait for the past 10 years. His first language is Arabic, however, hence his inclusion with Arab NNS.
Eight of the 30 NNS raters held a Master’s degree, and the remainder (22) held Bachelor’s degrees. Unlike the NES, none of the NNS held CELTA or DELTA certificates, as, contrary to employees of the British Council, they are not a requirement for work in Kuwaiti government educational institutes. Finally, 14 of the 30 NNS were male and 16 were female. A summary of the information pertinent to the NNS raters is presented in table 3.2. Further details on NNS raters are available in Appendix 6.

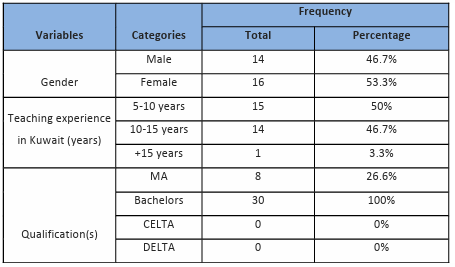
4.4 Instruments.
This section covers the 24 written scripts used in this investigation, the analytic rating scale, the task
sheet that participants were instructed to follow, the Coh-Metrix tool used to both analyse the
scripts and calculate the mean average sentence length, and the interviews.
4.4.1 The written scripts.
After obtaining permission from the British Council in Kuwait, twenty-four written scripts were chosen from a pool of nearly 100 scripts from 8 adult Intermediate classes over a number of taught courses. The British Council place students in classes according to their scores on a placement test, thus all students in the same class are of a similar second language proficiency level. The purpose of choosing scripts written by the students at intermediate level of L2 proficiency is twofold: (1) to eliminate potential rater bias towards higher or lower ability students, which, as the literature suggests, exists (Kondo-Brown, 2002; Schaefer, 2008), and (2) to choose students who represent the general population of students attending Kuwait University. One prerequisite of admission to Kuwait University is, in most cases, a score of 60 on the Kuwait University Admission Test of English, or a score of 4.5 on the International English Language Testing System (IELTS), which is equivalent to Intermediate level on the British Council Placement Test. Thus, a large number of students at universities in Kuwait are at the intermediate level or above. Moreover, many secondary school and university students, including teacher trainees, attend courses at the British Council in Kuwait to improve their overall language proficiency (see Al-Nwaiem, 2012).
The writing task was a timed essay (see section 2.2) which was completed in class by the students within 40 minutes. All twenty-four scripts had been awarded a holistic/impressionistic score of ‘very good’ by the same class teacher. As a result, I managed to obtain 24 scripts written under similar conditions (in class), by students of the same level according to the placement test (Intermediate), who had received the same holistic score by the same class teacher. It is worth noting that the class teacher did make a point that his holistic (impressionistic) scores (Excellent-Very Good-Good Average-Insufficient) were in relation to that level (Intermediate). In other words, his evaluations were norm referenced- that is, measuring performance against the normative performance of a group (Henning, 1987, p.194), rather than criterion referenced- that is, measuring performance against a cut off score (Henning, 1987, p.190). Thus a score of ‘Excellent’ may not be ‘Excellent’ at an Upper-intermediate class in the British Council.
The task prompt was:
“Imagine that you had no TV, computer, internet, mobile phone, or video games for one week. Think of some activities that you can do instead to keep you busy and out of trouble. In no more than 200 words write an essay to explain what you can do to keep occupied in a week of no TV, computer, internet, mobile phone, or video games.”
The aforementioned topic, which is similar to the type used by Engelhard (1992), was chosen on the basis that it would be unlikely to elicit emotion from either students or raters and would not, therefore, hinder rational thinking as was the case with Lee (2009). Moreover, the topic required no familiarity from either the students or raters and thus, unlike Lee (2009), neither NES nor NNS were at a disadvantage. The topic was unambiguous with clear instructions and was one that I believed would engage students because its implications were pertinent to their personal lives (Crusan, 2010). Topics that interest students are said to result in better student writing (White, 1998).
The number of words required of the students in this study (200 words) was identical to that of the task in Hyland and Anan’s’ (2006) investigation. Like Hyland and Anan, I also believed this to be an adequate number that would not ‘burden’ the research participants. Scripts that were 20 words over or below the 200-word limit were not used. Furthermore, for optimum results on the Coh-Metrix, it is recommended to analyse scripts that are at least 200 words long. The class teacher invited all students to sign the consent forms (see appendix 1), informing them that their work may be used for research purposes. Their names were deleted before the copies were handed over to ensure anonymity.
Furthermore, like Song and Caruso (1996), a computer was used to type and print the 24 scripts for the sake of clarity. This was to overcome the influence the literature suggests that handwriting may have on the process of scoring written work (Briggs, 1970; Briggs, 1980; Eames and Loewenthal, 1990; Henning, 1987; Massey, 1983; Shaw and Weir, 2007; Weigle, 2002). Every script was typed as written in the original students’ work, thus the organization of paragraphs, spelling mistakes etc., were carried over. The twenty-four scripts were typewritten by me and a fellow post graduate student and only when both typewritten scripts were identical were they used (a reliability score of
1). The printed scripts given to the raters can be found in appendices 7-30, and the original handwritten versions in appendices 31-54.
To establish whether the mean average sentence length of written scripts was a factor that influenced the process of scoring written work, only scripts that were within the 200 word limit were selected; and of these 12 scripts with a mean average of 30 words per sentence (long) and 12 scripts with a mean average of 12 words per sentence (short). This was achieved by first running the Coh Metrix analysis (see the following section) on all 100 scripts. Twelve scripts with the shortest average sentence length and 12 with the longest were selected. Some short scripts were omitted owing to the excessive use of one-word sentences (e.g., “OK”, “So”, “Nice”, etc). This naturally lowered the average sentence length of that script. Similarly, long scripts containing +55 word-long sentences were removed since they skewed the overall average sentence length of the script. Therefore, I made the decision to choose scripts based not only on the average sentence length (mean), but also on the median and mode of the scripts’ sentence length.
4.4.2 The Coh-Metrix tool.
The Coh-Metrix (version 3.0) is an “automated tool that provides linguistic indices for text and discourse” (McNamara and Graesser, 2011, p.2). The tool was designed to measure and provide analysis on a wide range of language and discourse features that fall under the following categories: Descriptive (11 indices), Text Easability Principle component score (16 indices), Referential Cohesion (10 indices), Latent Semantic Analysis (LSA) (8 indices), Lexical Diversity (4 indices), Connectives (9 indices), Situational Model (8 indices), Sytactic Complexity (7 indices), Syntactic Pattern Density (8 indices), Word Information (22 indices) and Readability (3 indices). Since its design in 2002, numerous exploratory studies have been carried out to validate the indices (see Bell et al, 2011; Crossley and McNamara, 2009; Duran et al, 2007; Hall et al, 2007; Louwerse et al, 2004; McCarthy et al, 2006; McCarthy et al, 2008; McNamara and Graesser, 2011; McNamar et al, 2006; McNamara et al, 2007; McNamara et al, 2010). To establish whether sentence length was a factor that influenced the process of scoring written work, all chosen 24 scripts were analysed using the online Coh-Metrix tool to ensure they had similar characteristics and values (indices). The only indices for which different values were expected were all those pertinent to average sentence length (e.g., syntactic indices, readability indices). For a detailed look at the indices of all 24 scripts and how the data was entered into Coh-Metrix, refer to appendices 7-30. A summary comparing the average indices of the scripts with short sentences to the average indices of the scripts with long sentences is presented in appendix 40.
4.4.3 The rating scale.
I made the decision to use an analytic rating scale for this study as the literature suggests that it is: (a) better suited for EFL students as are most Kuwaitis, (b) more reliable than holistic (impressionistic) scoring, and (c) better able to identify the strengths and weaknesses of written work (Bachman and Palmer, 2010; Barkaoui, 2010; Crusan, 2014; Weigle, 2002). That is not to say that analytic rating is without its limitations (see section 2.4). For example, even though analytic scoring is more desirable in an ESL/EFL setting, it is far less practical than holistic/impressionistic scoring and is more expensive and time-consuming (Crusan, 2010; Weigle, 2002). Moreover, Weigle (2002) argues that raters could display a halo effect when using analytic scales, i.e., they develop an overall (holistic) evaluation/impression of written work then proceed to score each criterion accordingly. However, this limitation, according to Knoch (2009), mainly affects the diagnostic feedback that students receive. Furthermore, Barkaoui (2010) reported that the majority of his raters (experienced and novice) generally expressed their preference for the analytic rating scale since they deemed it more suitable for rating scripts that exhibited varying levels of proficiency in different writing features (p.68). Another reason that led me to use an analytic scale is Johnson and Lim (2009) in their study of rater language background effect on the evaluation of writing, found no discernible pattern of rater bias. However, they make a point that they used a holistic rating scale, and question whether it “could be that if analytic scoring were used, where different components are identified and separately rated, and where greater nuance is required, that rater language background effects might be measured and detected” (ibid, p.502). This investigation will attempt to answer this question by using an analytic rating scale.
The choice of the analytic rating scale used in this study was a matter of negotiation to some extent. The plan was to use a 5-9-point scale that the participants would choose and feel comfortable with rather than impose what I believed to be the most convenient scale, as was the case with other previous research (Shohamy et al, 1992; Song and Caruso, 1996; Connor-Linton, 1995b; Lee, 2009). During the pilot study, five NES and five NNS were presented with the following analytic rating scales: the IELTS writing task band descriptors (the public version), Brown and Bailey’s Analytic scale for rating composition tasks (cited in Brown and Abeywickrama, 2010, p.286-7), and the ESL writing: linguistic scale (Shohamy et al., 1992). They were then asked to choose the scale they thought best suited for scoring a random script taken from the original 80 scripts used in this investigation. During the pilot study, seven of the 10 raters (4 NES and 3 NNS) chose the IELTS scale, two chose Shohamy’s scale (1 NES and 1 NNS), and one NNS rater was undecided. Those who chose the IELTS scale cited reasons such as “clarity” and the “user-friendly” nature of the scale. The remaining three raters were all in agreement that, even though they had chosen a different scale, the IELTS scale was, nonetheless, “suitable”, “clear” and “user-friendly”.
As none of the raters had reported any problems related to the rating scale when scoring the random script during the pilot study, the IELTS scale was used in this investigation. That is not to say that the scale is without its limitations though. Ideally, one would use a scale designed specifically for the writing task. However, a trade-off needed to be made here. Designing a rating scale specific to the task would be beyond the scope of this investigation (see Knoch, 2009), therefore, using a readymade scale was the only practical option in this investigation. In addition, the quantitative results of the study using the MFRM, specifically the Rating scale functioning report, suggested that the scale was generally usable (see section 5.6 and table 5.10). Furthermore, the majority of the raters in the second set of interviews generally expressed a positive attitude towards the scale. The chosen IELTS analytic scale was a 9-point scale with 4 categories/criteria: Task achievement, Coherence and Cohesion, Lexical resource, Grammatical range and accuracy (see appendix 3). It was developed as part of the IELTS Writing Assessment Revision Project, which began in the summer of 2001 and was operational at the beginning of 2005 (Shaw and Weir, 2007). It was vigorously researched and ‘empirically grounded’, according to examiners who took part in the project (Shaw and Weir, 2007, p.166). Moreover, examiners also felt that this scale was clearer and fairer to test takers than the previous one (ibid, 2007). It is a constructor-oriented scale that follows a communicative competence model (Knoch, 2011). The literature suggests that the advantages of 5-9 point analytic scales are twofold: (a) they are better suited for distinguishing and discriminating between scores of written work, and (b) are more reliable than other types of analytic rating scales, e.g., 0-4 point scales and +9 point scales (Knoch, 2011; North, 2003; Miller, 1956; Myford, 2002). A detailed account of the project; its purpose, procedures, phases, and its results can be found in the project report (Shaw and Flavey, 2007). Additionally, the scale is very similar to the one used by Kim and Gennaro (2012, p.340-2), except theirs was a 6-point scale as opposed to the 9-point scale we used here. The suitability of this rating scale will be inspected using the Rating scale functioning report, which is produced by the MFRM.
It is worth mentioning that Weigle makes a point that the majority of teachers have never taken courses in testing/assessment/evaluation of written work and that very little time is devoted to the topic of writing assessment in teaching writing courses (2007, p.194). As a graduate from Kuwait University and having worked for the British Council in Kuwait, the Public Authority for Applied Education and Training and Nasser Saud al Sabah School for over 5 years, I concur that no priority is given to rater training.
4.4.4 The instructions.
The envelopes contained an instruction sheet (see appendix 9) which presented a brief overview of the investigation followed by three points of instruction. Furthermore, my contact information was provided for any further enquiries. These three instructions were piloted during the pilot study and an explanation/rationale for each one is given below.
1. “Set a timer as soon as you begin reading each script”.
Differences in scores may be a result of spending more (or less) time on the script. The amount of time spent on each written script may have an impact on the score the script is awarded (Vaughan, 1991, cited in Shaw and Weir, 2007). Thus, times were recorded and compared; if there was a substantial difference observed between the two groups (NES and NNS) or between the two scripts (scripts with short sentences and scripts with long sentences), a mixed ANOVA would be used to establish whether a statistically significant difference exists (p< .05), and if so, the significantly different interaction(s) located.
2. “On the task sheet, note down the time taken to read and score the script in addition to the total number of times you read the script in order to allocate a score. Then turn off the timer”.
During the pilot study ‘turn off the timer’ was a separate instruction. A number of raters suggested that it should be included with instruction 2 for the sake of clarity. Time taken to read and score the script, in addition to the number of times raters read the script, could potentially be a variable that influences the scores. Initially, it was planned to limit the number of times the raters should read the script before allocating a score but later that was deemed impractical. Instead, in order to mimic real-life scoring conditions and ensure authenticity, they were asked to note down the number of times they had read each script which could then be considered during analysis in a similar way to the previous instruction (time spent scoring).
3. “Score only one script a day”.
There is some evidence that as raters start to fatigue, their ratings can ‘drift’ (Van Moere, 2014, p.4). Lunz and Stahl (1990) found that rater consistency decreased with the more scripts they scored. As a result, I felt it was best to limit the number of scripts to one per day. This would ensure that they did not ‘drift’ or suffer from fatigue that may influence their ratings.
My contact information (mobile phone number and email) was not initially provided during the pilot study, but was added after a suggestion by several participants. In addition to the printed instruction sheet, all instructions were explained verbally together with a brief demonstration of the procedure.
4.4.5 Interviews.
To establish whether sentence length was a factor that influenced raters’ scoring of written work, I conducted two sets of interviews to explore their perceptions of scoring written work and ascertain the reasoning for their judgments and whether sentence length influenced their assessment in any way. I chose to conduct a semi-structured interview as I believed it would be more advantageous in that it would: (a) allow for a more intimate understanding of the participants’ (raters’) perceptions and how/whether sentence length influenced their scores (Hermanowicz, 2002; Cohen et al, 2000), and (b) allow me to develop unexpected themes (Burges, 1984).
The first set of interviews were somewhat problematic; they were conducted several months after the actual ratings, and raters’ scores could not be traced back to them. That was because I was short-sighted and did not feel that I needed to interview any of my participants at that moment in time. However, after observing some of my quantitative findings it quickly became apparent how wrong I was. As a result, a first set of interviews were conducted with seven of the 60 raters (four NES and three NNS). These raters were once again presented with four scripts (two containing short sentences and two containing long sentences), and asked to rate them again. They were then asked why they rated one type of script (i.e., short/long sentences) more favourably than another. The problem here was that only the raw scores were being observed, and these raw scores may not translate to significant biases (i.e., awarding scores that were more lenient or severe than expected). In addition, observing the raw scores of only four scripts cannot establish whether a bias interaction pattern existed between the raters and type of script (short/long sentences). The transcripts of the seven interviews are presented in Appendices 31-37.
The second set of interviews, on the other hand, included 14 new participants (10 NNS and four NES) who rated 12 scripts (six scripts with short sentences and six scripts with long sentences). A retrospective method with memory aid (stimulated recall) was adopted (Sasaki, 2014) here where raters were interviewed right after scoring the scripts. It was my hope that this retrospective data would complement the quantitative data and aid in arriving at a more beneficial explanation of why raters exhibited biases towards any scripts (see Phakiti, 2003). More specifically, whether sentence length influenced the scores and their biases. This method of interviewing right after they rate the scripts, according to Gass and Mackey (2000), should encourage the raters to cite reasons for their biases that more closely reflect their thinking. It is worth noting that the validity of this method has been questioned since the data this method produces may not accurately represent participants’ thinking at the time. To overcome this Sasaki (2014) suggests minimizing the time between the task (rating) and the reporting (interview), which I believe I have done here on the second set of interviews.
I began the interview by giving a brief summary of this investigation (Hermanowicz, 2002), after which the raters were asked about the general proficiency of the scripts, and whether they were higher than that of their students. This was to account for the influence of order effect. For example, an average script may be awarded a higher score by raters who are used to rating below average scripts and a lower score by raters who are used to scoring above average scripts (Field, 2013; Shaw and Weir, 2007; Weigle, 2002). After that, raters were asked about the rating scale; their experience using rating scales, their attitude towards the rating scale used in this investigation, and the difficulty they may have had using the rating scale. Then, they were asked about the scores they awarded, particularly in relation to their biases, and by comparing the scores of pairs of scripts with short sentences and scripts with long sentences. Finally, they were made aware of the length of the sentences in the scripts and the influence of sentence length was discussed. The semi-structured interview schedule is presented in Appendix 43 The interviews lasted roughly 50 minutes on average, which was slightly shorter than the 60-90 minutes that Hermanowicz (2002) recommends. Nonetheless, this proved more than enough time for me and was ideal for teachers with full schedules who were pressed for time and interviewed during a school day (after spending roughly two hours rating the scripts). Details of the amount of time spent with each participant are provided in table 4.3. The transcripts of each interview can be found in appendices 31-37.

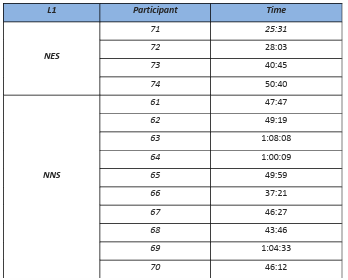
All the interviews were transcribed by the author, and then a fellow PhD candidate in applied linguistics listened to two of the interviews to check the accuracy of the transcription (rater 61 NNS and 71 NES). No mistakes or errors were found, and thus the transcription was deemed satisfactory. The transcripts are presented in Appendix 46-60.
A lot of the qualitative studies pertinent to raters focused on the process of rating and what went on in the minds of raters while they were rating using verbal protocols to arrive at a model of rater decision-making (Baker, 2012; Cumming, 1990; Cumming et al., 2001; Deremer, 1989; Freedman and Calfee, 1983; Milanovic et al., 1996; Lumley, 2002 and 2005; Sakyi, 2000; Vaughan, 1991). However, the focus of the qualitative data (interviews) in this investigation is to ascertain whether sentence length had an influence on raters when rating the scripts. Thus, their purpose is to verify the quantitative findings of why raters overestimated/underestimated scripts, and not stand as an independent research question.
4.5 Procedure.
The process of data collection and data analysis will be covered in the following sections.
4.5.1 Data collection.
All the material (24 scripts, rating scale, instructions, and consent letter) was given to the participants in an envelope. All the participants returned the envelopes within 30 days. The scripts were placed in a random order to overcome any order effect (Field, 2013).
4.5.2 Data reduction: Coding.
The coding framework of this investigation generally followed the advice of Coffey and Atkinson (1996), Cohen et al. (2005), and Revesz (2012), and the NVIVO 10 software was used to code the data. After reading and re-reading the transcripts I began by open coding the data. That is, I assigned one or two word summaries to each unit of analysis (word, phrase, sentence, or paragraph) in the transcript that highlighted interesting or salient features. After that I analyzed the entire list of open codes (94 codes in total) making constant comparisons and looking for similarities/redundancies to reduce the long list of codes to a shorter more manageable list. As a result, I managed to reduce the number of codes to around 60 in total. This reduction was also aided by word frequency queries provided by NVivo (matching exact words, including stemmed words, and including synonyms), where words like ‘ideas’, ‘activities’, ‘vocabulary’, ‘grammar’, and ‘mistakes’ were among the most frequent. Upon further inspection, it was noted that many of these codes could be easily categorized based on the interview questions. So, the first main category I had was ‘rating scale’, where all the codes and comments about the scale (attitude, difficulty, experience) would fall under. The second main category was ‘proficiency’, where all the codes comparing the proficiency of the scripts to that of the raters’ students would fall under (higher than their students, or a mixture of higher and lower). The third and fourth main categories were pertinent to the written scripts; comments and codes relating to the accuracy of the scripts (e.g., grammar, spelling, punctuation, etc.) and global features of the script (e.g., organization, paragraphing, coherence, ideas, etc.).
The fifth main category was pertinent to sentence length (raters’ preference, their reasons for preference, their awareness of sentence length, etc.). The final category was pertinent to teachers’ practices when teaching writing or rating written work. In addition, I noticed that some of the quotes in the codes had different levels and hierarchies. For instance, after running a few word frequency queries on NVivo (word frequency, word trees, cluster analysis), I observed that a considerable portion of the quotes under the code ‘grammar’ (in the category accuracy) were associated with the term ‘mistakes’. Thus, a new sub-code was derived named ‘mistakes’ where all the quotes about grammatical mistakes would fall under. I felt fairly confident that the six main categories, with their codes and sub-codes fully reflected the purpose of my investigation, were exhaustive, and sensitive to my data. To ensure reliability of coding, three full interview transcripts (raters 61 NNS, 62 NNS and 71 NES) were coded by a certified NVivo instructor with over 10 years of experience teaching qualitative data analysis, using the list I drew up. We achieved an inter-rater reliability of 90% on the first attempt. I, thus, felt extremely confident in my coding and preceded to code the rest of the data myself. The table of main categories, codes and sub-codes (along with their definitions, examples and frequency counts) is presented in Appendix 44.
For the purpose of analysis, I also coded everything that was said about each script and treated it as a separate data document. So, all the comments about Script 1 (short sentences) by all the participants were placed in a code called ‘Script 1’, all the comments about Script 2 (short sentences) in a code called ‘Script 2’, and so forth. In addition, I highlighted all the overestimations (scores that were more lenient than expected)and underestimations (scores that were more severe than expected) for each rater on each script, then made a separate sub-code for all the comments. Meaning, under the code ‘Script 1’ I had two sub-codes (or child nodes in NVivo), one was ‘Script 1 overestimations’ and the other ‘Script 1 underestimations’. The aforementioned classification of code and sub codes was extremely beneficial. It allowed me to clearly analyze the script in terms of commonalities and differences in what those who overestimated it said, and what those who underestimated it said. One of the problems with the data analysis of the first set of interviews I felt was that I analyzed the data by observing it from only two angles: (a) what the raters said, and (b) what the codes contained. This slight adjustment allowed me to analyze my data from a whole new perspective that would result in a much sounder analysis.
4.5.3 Data analysis.
All the data in this investigation was analysed using IBM version 21.0 of SPSS, the R program and the FACETS program (version 3.71.4). As in previous literature (Connor-Linton, 1995b; Lee, 2009; Shi, 2001) the reliability coefficient was calculated first to measure traditional rater consistency estimates. A cluster analysis of raters and cluster analysis of scripts was then presented using the R program. This is to establish whether: (a) there were any other natural groupings of raters unrelated to their L1 (other than NES and NNS) and (b) whether the written scripts could be grouped in a different way (other than scripts with short sentences on average and scripts with long sentences). The former cluster analysis was based on raters’ scoring patterns whereas the latter was based on the scripts’ index values on the Coh-Metrix tool. Before running the analyses for the research questions, a Rater Vertical Ruler (also known as the facets map/summary map/Wright map) was presented, using the FACETS program. This is to visually explore the three facets (raters, scripts and criteria) in relation to one another. Moreover, FACETS was also used to produce a scale
measurement report and rating scale category (scores 1-9) statistics. These are useful in examining
how well the rating scale functioned in this investigation.
For research question 1:
Is there a significant difference (t> 2) in the overall degree of severity of raters who scored the scripts
using the analytic scale?
The FACETS program was used to produce a rater measurement report. This table tells us the extent
to which raters differed in their overall severity degrees, and whether these differences in severity
are significant.
For research question 2:
Is there a significant bias interaction (t> +/- 2) between raters and scripts?
And research question 3:
Is there a significant bias interaction (t> +/- 2) between raters and criteria?
FACETS produced a two-way bias analysis interaction between rater x script and rater x category
respectively. This is to examine whether raters exhibited any systematic degrees of severity based
on the script type (short sentences and long sentences), or criteria of the analytic scale.
As for Research question 4:
Is there a significant bias interaction (t> +/- 2) between raters, scripts, and criteria?
This question was also analysed using the FACETS program. Unlike the previous two research
questions, this question was analysed using a three-way bias interaction analysis (rater x script x
criteria). This is to explore whether any significant rater bias patterns can be detected based on
script and criteria.
In addition, all the interview transcripts were coded and analysed using the NVivo 10 software. I
generally adopted a combination of an inductive (bottom-up) approach, that is- allowing the
concepts to emerge from the data, and a deductive (top-down) approach (i.e., testing the hypothesis
that sentence length had an influence on the scores raters awarded).
4.6 Pilot study.
This pilot study set out to explore the feasibility of this PhD investigation. It provided a thorough review of all the methodologies and, after analysis of the data, assessed whether the investigation of sentence length as a factor that influences the process of scoring written work is worthwhile. Subsequently, all the original data from the pilot study was deemed suitable and was incorporated into the main study during the latter stages. The procedure of this pilot study involved the testing of 6 participants (3 NES and 3NNS). The 3 NES teachers are employed by the British Council in Kuwait whereas the 3 NNS are teachers at Kuwait University. All six participants had at least five years of teaching experience in Kuwait.
Firstly, four written scripts were collected from an intermediate class at the British Council in Kuwait (all the students are above the age of 18 and had signed consent forms). An effort was made to choose four scripts that differ in mean average sentence length. This was done using the Coh-Metrix tool to ensure consistency in word count, sentence count and average sentence length. Secondly, the participants chose the analytic scale they deemed suitable for the chosen scripts (see section 3.4.3). Thirdly, participants were given envelopes containing the four aforementioned written scripts, the analytic rating scale, a consent form, the task and an instruction sheet. Furthermore, the task and instructions were explained verbally along with a demonstration. They were then allowed up to one week to complete the task. While the instructions were being explained verbally, two NNS raters felt that the instruction sheet could be reduced to fewer points for the sake of clarity (see section 4.4.4).
The results of the pilot (data) were insufficient to perform any meaningful tests using SPSS. It was apparent, nonetheless, that the NES scored the two short average sentence length scripts more favourably than the long ones, whereas the NNS did the reverse by scoring the long scripts more favourably. Since there is a dearth of literature on the effect of average sentence length on raters, this result prompted me to explore Research Question 2 more fully in the investigation. It stands to reason they may have scored them differently on other grounds.
4.7 Ethical considerations.
Once the ethics approval was successfully obtained from the University of Sheffield, I contacted the British Council in Kuwait informing them of my research and intention to choose written scripts from an intermediate class. They were given the assurance that all data collected would be treated with confidentiality.
All students (+80) who submitted their written work agreed to sign consent forms outlining the purpose of the research and ensuring anonymity and confidentiality (see appendix 1). Moreover, their class teacher, who had also signed a consent form, passed on the copies with names deleted which further ensured student anonymity. Finally, all the chosen scripts, originally handwritten, were printed and presented to the raters. The 60 raters who took part in this investigation were also invited to sign consent forms informing them of the purpose of the research, and guaranteeing that their participation (the scores they awarded) would remain anonymous and confidential. All raters were assigned a number and code, e.g., Rater 1 (NES 1), Rater 2 (NES 2) through to Rater 60 (NNS 60) during this investigation. The raters who agreed to take part in the interview process signed a new consent form informing them that the interview would be recorded for research purposes, and that once the investigation was complete, these recordings would be deleted (see appendix 38). Finally, all raters were given my contact information (mobile phone number and email) in the event of any queries or concerns. However, none of the participants chose to contact me.
4.8 Chapter 4 summary.
This chapter outlines the mixed method research design that was used and its advantages (section 4.1), the research questions and hypotheses with brief explanations (section 4.2), details about the participants and the setting (section 4.3). The four instruments used in this study (written scripts, the analytic rating scale, instructions sheet and the Coh-Metrix tool) were then explained (section 4.4) followed by the procedure (section 4.5), data collection (section 4.5.1), and analysis of the data (section 4.5), where all the statistical tests that I used are briefly covered. Finally, the pilot study (section 4.6), and ethical considerations (section 4.7) were discussed. The analyses, findings and discussion of results from this investigation are available in the following chapter.
Chapter V
Results, Analysis and Discussion.
This chapter covers the findings and analyses of this investigation. It begins by presenting the findings and analyses of the pre-tests, followed by the findings and analyses of the three main research questions. The pre-tests covered are: (1) raters’ inter-rater reliability coefficient, (2) the Coh-Metrix results, (3) the interaction between raters’ L1 and time spent scoring the scripts, (4) the interaction between raters’ L1 and the number of times they read the scripts before scoring them, and (5) a cluster analysis. Each research question will be answered and analysed in detail before a summary of the main findings is presented at the end of each question.
5.1 Inter-rater reliability.
The first pre-test was to check the consistency of the raters by observing their overall interclass correlation coefficients. This is a descriptive statistic that measures how strongly raters yield consistent scores when rating the same script (Bachman, 2004). In other words, the test measures their scoring consistency in relation to one another based on rank order. The coefficient score ranges from 0-1 whereby the coefficients closer to 1 are deemed more reliable. Although nothing is set in stone in the literature regarding what is an acceptable inter-rater reliability coefficient score, there is general consensus amongst language testers that a coefficient of 0.8 is the minimum required for raters when scoring language performance (speaking or writing) (Eckes, 2011). The overall inter-rater reliability, and the inter-rater reliability of each group (NES and NNS) on all the four criteria of the analytic scale is presented in table 5.1.

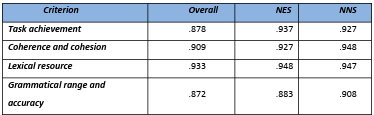
The coefficients are fairly high, indicating a strong consistency amongst the raters overall and the raters within each group. This is consistent with the assertion that analytic scales contribute a great deal towards improved reliability coefficients (Brown, 1991; Weigle, 2002). These coefficients were rather surprising when one considers that none of the raters had any form of rater training and it was the first time that they used this particular rating scale. The coefficients were higher than those found in Lee’s (2009) study, even though her raters had formal training. Perhaps the small number of participants in her study was a contributing factor (10 raters: 5 NES and 5 NNS). It is worth noting that these high consistency estimates could very well mask significant differences in rater severity, especially when observing the reliability estimates of pairs of raters (Bond and Fox, 2007; Eckes, 2011; also see section 2.7.1).
5.2 The Coh-Metrix results.
The Coh-Metrix (version 3.0) is an automated scoring tool that was designed to measure and provide analysis on a wide range of language and discourse features (indices) found in written discourse. To investigate the role sentence length had on the scores awarded by raters on written scripts, it was critical to take into account other features of writing that may have influenced the scores awarded. All the scripts were analysed using the Coh-Metrix (see appendices 7-30), then the average indices scores for the scripts with short sentences were compared to the average indices scores of the scripts with long sentences. This was to ensure that differences between the two script types were only pertinent to sentence length. As a result, indices related to sentence length (e.g., Syntactic simplicity, Readability, Number of sentences, etc.) should be strikingly different, but all other indices should remain similar. Appendix 40 presents a comparison of the average scores for all the indices on the scripts with short sentences and scripts with long sentences. The indices provide a general and basic insight into the linguistic complexity of written texts. These indices demonstrate that, apart from sentence length and all indices pertinent to sentence length, both script types (short sentences and long sentences) were fairly similar in terms of linguistic features and complexity. However, it should be kept in mind that these indices are based on individual words. They cannot take into account multi-word expressions which play a vital role in writing proficiency.
5.3 Time spent scoring the scripts.
The amount of time raters spent on each script could have influenced the scores they awarded. As a result, I timed each rater as they rated each script. The average time spent by each group on each script type is summarized in table 5.3. Overall, there was very little difference between the two groups on the two script types.

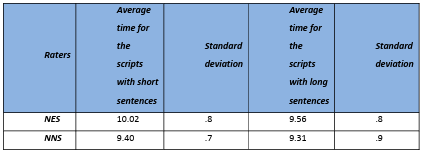
5.4 Number of times scripts were read before scoring.
Since raters had used an analytic rating scale when scoring the written scripts, I wanted to establish whether the number of times that they had read each script before awarding a score was a variable that had a bearing on the outcome. Possibly a higher number of reads would equate to a variance in scores. Thus, each rater noted the total number of times that they had read the script before assigning a score.
Results show that nearly all the raters read the scripts twice on average. This average was generally to be expected as the literature suggests that raters first read a script to form an overall opinion followed by another to arrive at a score (Milanovic et al, 1996; Shaw and Weir, 2007). Moreover, there was no substantial difference between the number of times the scripts with short sentences were read and the number of times the long scripts were read by either group (NES or NNS). These results are summarised in table 5.4.


5.5 Cluster Analysis.
Before running the tests, a few cluster analyses were run to see whether there was any other natural grouping of the two main effects (raters and scripts’ average sentence length) which were different from those initially identified. Cluster analysis is an exploratory, as opposed to confirmatory, statistical procedure. There is no hypothesis to reject or retain based on the findings per se, but rather the analysis identifies homogenous groups/sub-groups (known as clusters) which share similar characteristics (Dörnyei, 2007, p.237).
In this investigation raters were grouped according to their L1 (NES and NNS), and scripts were grouped according to sentence length (scripts with short sentences on average and scripts with long sentences on average). However, I wanted to explore whether: (1) raters would be grouped in a different way based on the scores they had awarded the scripts, and (2) whether scripts would be grouped in a different way based on their indices’ scores on the Coh-Metrix tool. This is achieved via the agglomerative hierarchical cluster analysis, also known as segmentation. The goal here is to arrange the raters/scripts into a natural hierarchy. This method first treats every rater/script as a unique cluster and then joins each rater/script with the rater(s)/script(s) whose scores are the most similar. These clusters are then linked to other clusters that share similar scoring patterns/Coh Metrix indices’ scores to form even larger clusters. This process continues until all the clusters are clustered together in one tree-like cluster, also known as a dendrogram (Everitt and Landau, 2011). In other words, the closer the members are under the dendrogram, the more alike they are in terms of scoring pattern (for raters), and indices scores (for scripts). The number of clusters was determined using the R program, rather than visual inspection, which is not always as accurate or as straightforward (Everitt and Landau, 2011). Each cluster analysis will begin with a visual presentation (dendrogram) of the cluster groups followed by a brief explanation and discussion of the cluster group members. This type of analysis is advantageous because the classifications and groupings are based on a more theoretically sound framework, as opposed to simply grouping raters and scripts in a hypothetical or intuitive manner, i.e., Native vs Non-native. It stands to reason that NES and NNS are two distinguishable groups, but would they be grouped that way if only their scoring patterns were taken into consideration? Johnson and Lim (2009) argue that if they (NES and NNS) share similar scoring patterns then it is pointless categorising them according to their native status. This is the reason a cluster analysis is beneficial as raters are clustered into groups based solely on their scoring patterns. The following section (5.5.1) will explore how raters were clustered based on the scores they awarded, then the section after (5.5.2) will explore how the scripts were clustered based on their indices on the Coh-Metrix tool.
5.5.1 Cluster analysis for raters.
Before running the main hypotheses tests, some cluster analyses were run to see whether there was
any other natural grouping of the first main effects (raters) other than those originally hypothesised
(NES and NNS). This cluster analysis explores the grouping of raters based on the scores they
awarded scripts with short sentences. It begins by exploring the rater cluster groups based on their
scores on the scripts with short sentences (scripts 1-12), then their cluster groups based on their
scores on scripts with long sentences (scripts 13-24), then finally their cluster groups based on their
scores on all the 24 scripts combined.
When analysing raters’ scoring pattern on the scripts with short sentences three main cluster groups were found. These clusters demonstrate that, generally speaking, the NES and NNS each had a unique scoring pattern. The first main cluster group (cluster 1) consisted of 23 NNS and only 2 NES; the second main cluster (cluster 2) consisted only of 15 NES; and the third cluster (cluster 3) consisted of a mix of 13 NES and 7 NNS. Cluster one (majority NNS) awarded the lowest scores on average to the scripts with short sentences, whereas cluster 2 (all NES) awarded the highest scores on average to the scripts. These cluster groups are visually presented in a dendrogram (figure 5.1), and a cluster table (table 5.3). Each clusters’ mean average is presented in figure 5.2, and their median and score distribution is presented in a box-and-whisker plot (figure 5.3). It is worth further investigating the two NES raters that were grouped in cluster 1; their scoring patterns were very similar to a large number of NNS, and very distinguishable from the other NES. Similarly, it is also worth investigating all the raters in cluster 3. This group was a mix of NES and NNS who had very similar scoring patterns.

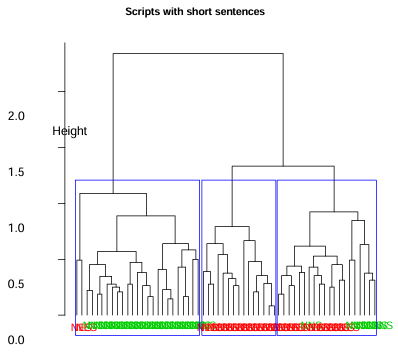

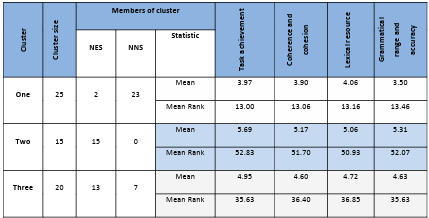

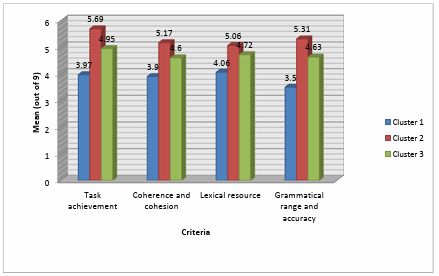

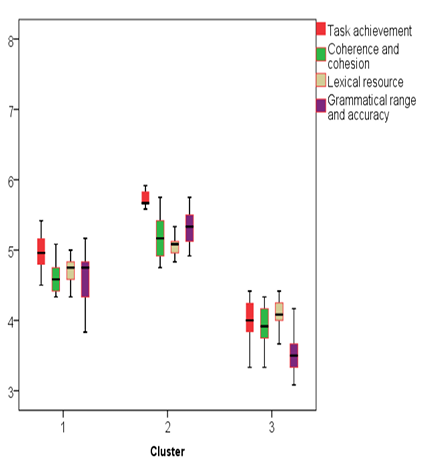
Similar to the short scripts, clustering the scores of the long scripts also produced 3 main clusters as shown in the dendrogram (figure 5.4). Only this time raters’ scoring pattern resulted in three clusters that clearly distinguished between raters according to their native status.

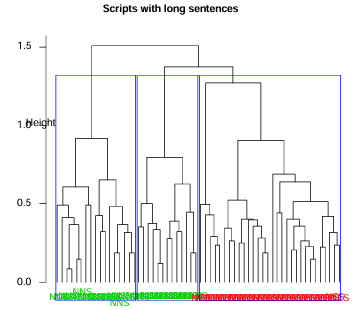
All the NES raters (30 raters) were grouped into a single cluster (cluster 3), the NNS, on the other hand, were split into two groups: cluster 2 (17 raters) and cluster 1 (13 raters). Contrary to the scripts with short sentences, the clusters consisting of NNS raters (clusters 1 and 2) included more lenient scorers. The NES cluster (cluster three) was the harshest when scoring scripts with long sentences on average, except for the criterion ‘grammatical range and accuracy’. The NES were the most lenient scorers of that criterion on long scripts. Table 5.4 presents details of the three clusters, their size, their mean ranks and mean scores on each criterion. Each cluster’s mean score is visually presented in figure 5.5, whereas their medians and distribution are presented in figure 5.6.
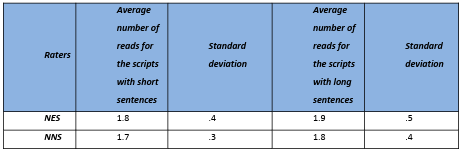

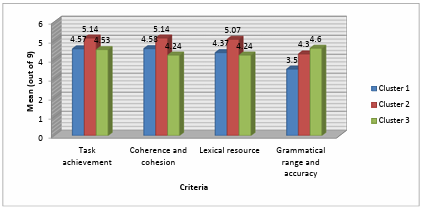

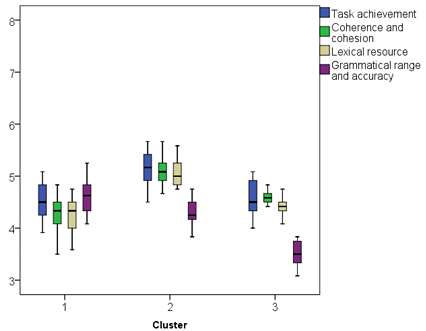
The previous two cluster analyses showed that the NES and NNS score scripts in a consistent but significantly different way with regards to script sentence length (p< .001). The NES generally score the scripts with short sentences on average far more leniently than the NNS. On the contrary, the majority of NNS raters score the scripts with long sentences more leniently than the NES. To verify this observation, a third cluster analysis was run. Raters were clustered according to their scores on all the scripts (scripts with short sentences and scripts with long sentences combined), and their scores on each script type is presented separately for ease of comparison. The dendrogram (figure 5.7) once again produced three main groups of raters based on their scores. The differences between NES and NNS become even more apparent here. When the raters were clustered according to their scores on the scripts with short sentences alone, 13 NES raters shared a cluster with 7 NNS raters, while only 2 NES raters shared a cluster with 23 NNS raters. On the long scripts’ clusters, no NES shared a cluster with a NNS. This was also seen to be the case when raters were clustered according to their scores on all 24 scripts. Cluster 1 consisted of 30 raters who were all NES, whereas cluster 2 and 3 had 7 and 23 NNS raters respectively. Members of cluster 2 were particularly interesting as their scoring pattern bordered the NES and NNS.
Table 5.5 provides the details of each cluster size, members, mean ranks and mean scores on all four criteria on both scripts (short sentences and long sentences). The mean scores are visually compared in figure 5.8. Each cluster’s distribution of scores on the scripts with short sentences and the scripts with long sentences is illustrated in a box-and-whisker plot (figure 5.9 and 5.10 respectively). An image plot (appendix 39 and 40) gives details of the specific raters in each cluster.

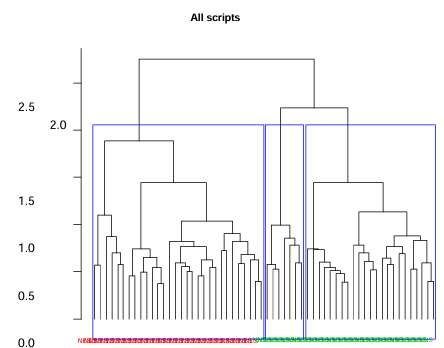

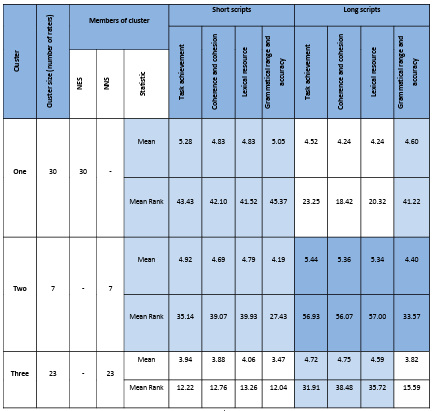

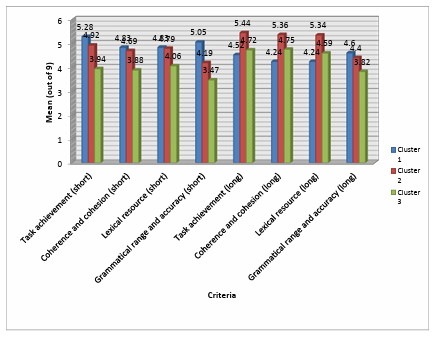
Figure 5.8 All scripts clusters’ mean averages.

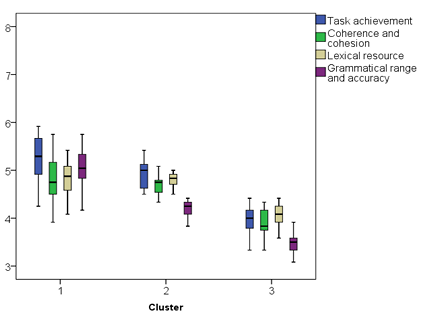

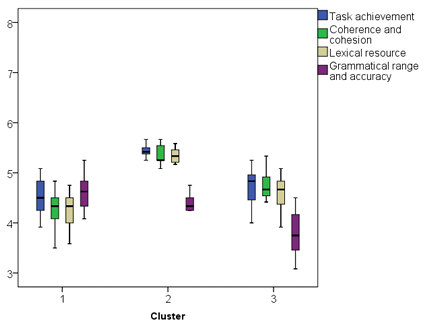
The previous three cluster analyses generally grouped raters who share the same L1 together based on the scores they awarded. NES on the whole were clustered together in one cluster with few or no NNS raters, and the NNS were clustered in separate clusters with few or no NES raters. The cluster analyses also showed that each group (cluster) had a unique pattern when scoring each type of script (scripts with short sentences and scripts with long sentences). The clusters that consisted of mainly NES raters scored the scripts with short sentences more generously than the scripts with long ones, whereas the clusters with chiefly NNS raters scored the scripts with long sentences more favourably. In conclusion, the distinction made between NES and NNS in this investigation is based on a more theoretically sound distinction, unlike in previous studies (i.e., Connor-Linton, 1995b; Shi, 2000; Li, 2009; Johnson and Lim, 2009) where the distinction was not based on empirical evidence. A line chart (figure 5.11 and 5.12) is presented to display the average scores for each group of raters (NES and NNS) on the four criteria on both script types (short sentences on average and long sentences) to verify the aforementioned findings.

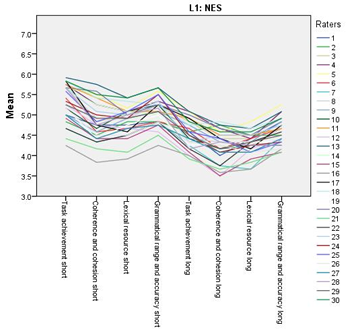

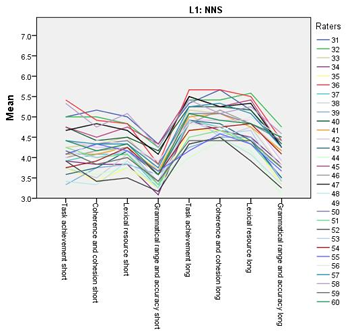
It is evident from the NES score line chart (figure 5.11) that the raters generally awarded a higher mark on average for the criterion ‘Task achievement’, lower scores on ‘Coherence and cohesion’ and ‘Lexical resource’, then higher once again for ‘Grammatical range and accuracy’. This pattern is consistent and is the case in both scripts with short sentences and scripts with long sentences, though it is apparent that the scripts with short sentences were scored more leniently than the long ones. The NNS score line chart (figure 5.12), on the other hand, shows that they tended to award similar marks on average for the criteria ‘Task achievement’, ‘Coherence and cohesion’, and ‘Lexical resource’, but their scores would drop for the criterion ‘Grammatical range and accuracy’. This pattern was similar to the NES in that it was both apparent and consistent in both short and long scripts. However, while the NES scored the short scripts more leniently, the NNS did the opposite and generally scored the long scripts more leniently. The two line charts above reaffirm the findings of the cluster analyses that show that each group has a distinct pattern of scoring the criteria and scripts based on the average sentence length.
Even though most of the literature differentiates between NES and NNS and treats them as two separate categories/groups, Johnson and Lim (2009) argue that “if NS (NES) and NNS raters can become indistinguishable from one another, native status would need not be a category” (p.501). The cluster analysis in this investigation found that, for the most part, raters cannot be indistinguishable in terms of their scoring pattern, and the line charts demonstrated that each group had its own unique scoring pattern. This contradicts the unstated language testing assumption that “whichever rater is making the judgment should be a matter of indifference to the test-taker” (Fulcher, 2003, p.52-53). Another advantage of the cluster analysis was establishing which NNS raters were most similar to NES raters. For example, on the scores of the scripts with short sentences, there were two NES raters who were placed in a cluster consisting of 23 NNS. This indicates that these two NES displayed scoring patterns that was more in common with the 23 NNS, as opposed to their own NES group. Similarly, when clustering the raters according to their scores on all the scripts, there were 7 NNS who were in a separate cluster wedged between a cluster comprising 30 NES and a cluster comprising 23 NNS.
This implies that those 7 raters, despite displaying NNS scoring patterns, were much closer in their scoring patterns to the NES than to the other 23 NNS. It can be argued that these unique cases may be indistinguishable in as far as scoring pattern is concerned and that these cases also merit further investigation; perhaps the proficiency level of these 7 was higher than the other raters in their group, thus explaining why they scored in a more native-like manner. These findings cannot be overlooked by testers in Claim 4 of the AUA. Moreover, they give an indication that the traditional approach to dealing with rater variance (establishing a high inter-rater reliability) is insufficient. Many of these raters, especially those of the same L1 group, had nearly identical scoring patterns, meaning their reliability estimates were very high. However, when compared to other raters, especially from the opposing L1 group differences began to emerge. Thus, a high inter-rater reliability coefficient between a pair of raters could be down to chance. This will lead to a misleading warrant in Claim 4 of the AUA. The following section will explore the clustering of scripts based on their indices on the Coh-Metrix tool.
5.5.2 Cluster analysis of written scripts.
This cluster analysis will group scripts together based on their scores on the 106 indices on the CohMetrix tool. The dendrogram (figure 5.13) shows that by and large, scripts could be grouped based on sentence length. There is a total of 3 main clusters; the first cluster was of one script only (script 6), the second consisted of 10 scripts (scripts 2, 3, 4, 5, 7, 8, 9, 10, 11, 12), and the final cluster consisted of 13 scripts (scripts 1, 13, 14, 15, 16, 17, 18, 19, 20, 21, 22, 23, 24). All the scripts in cluster 2 were originally classified as ‘scripts with short sentences’, whereas all the scripts in cluster 3, except script 1, were originally classified as ‘scripts with long sentences’.

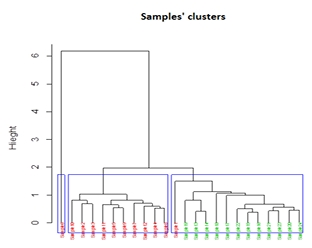
Cluster 1 proved slightly problematic in that it contained a single script. It had Coh-Metrix scores that were so unique that it was grouped alone in a single cluster. The fact that it is closer to cluster 2 than 3 indicates that, in terms of Coh-Metrix indices scores, the script has more in common with the scripts with short sentences than those with long sentences. However, it was too dissimilar from the scripts in cluster 2 to warrant being grouped with them. This script may potentially skew any future analysis and results, so extra care and attention was needed when running tests. It was, however, included in the ‘scripts with short sentences’ group when running the tests. Moreover, it was intriguing to observe how the raters scored this script. Script 1, which was in cluster 3, was also somewhat problematic. Even though it was classified as a script with short sentences on average, it had more in common with the scripts with long sentences, in terms of Coh-Metrix indices. Nonetheless, it is the closest script from cluster 3 to cluster 2, meaning that if any script from cluster 3 were to be placed in cluster 2 it would be script 1. It was decided, therefore, to keep it in the ‘scripts with short sentences’ group.
To sum up, the cluster analysis of scripts based on their Coh-Metrix indices did, on the whole, group scripts in an almost identical way to the one which was hypothesized (scripts with short sentences and scripts with long sentences). Only two scripts (script 6 and script 1) were somewhat problematic, but not to the extent of considering an alternative classification of scripts. However, should they be detected as outliers that may skew the results, they will be removed to meet test assumptions if necessary.
A summary of the major findings of this section are presented below:
• The cluster analysis generally differentiated between NES and NNS scores on the scripts with short sentences, the scripts with long sentences and all scripts combined, and usually grouped NES raters together in one cluster, and grouped the NNS raters in a different cluster(s).
• The average score line chart showed that NES would score Task achievement and Grammatical range and accuracy higher than Coherence and cohesion, whereas the NNS would generally score Grammatical range and accuracy lower than all the other criteria.
• The line chart and cluster analysis showed that NES scored the scripts with short sentences on average more leniently than the scripts with long sentences, but the NNS, on the other hand, scored the scripts with long sentences on average more leniently.
• The cluster analysis of scripts showed that the scripts with short sentences are generally distinguishable from the scripts with long sentences minus the exception of scripts 1 and 6.
5.6 Research question 1: Is there a significant difference (p< .05) in the overall degree of severity of raters who scored the scripts using the analytic scale?
H0 There is no significant difference (p> .05) in the overall degree of severity of raters who scored the scripts using the analytic scale.
H1 There is a significant difference (p< .05) in the overall degree of severity of raters who scored the scripts using the analytic scale.
This research question seeks to illuminate the extent to which raters varied in their systematic overall severity (or leniency) when rating the scripts. The main point of interest here is to establish whether raters in this investigation could generally function interchangeably, or in the words of Fulcher (2003) “whichever rater is making the judgment should be a matter of indifference to the test-taker” (ibid: p.52-53). If this is the case, then an argument for the validity of the test scores could be made in Claim 4 of the AUA, as significant differences in rater severity would result in construct-irrelevant variance. In other words, the variance in test scores would be due to factors other than the test-takers’ writing ability, namely rater variance (or rater severity in this case).
Rater severity measurements were estimated using the MFRM via the FACETS program. It is worth noting that raters’ severity degrees are estimated by observing their overall scores, but their L1 (NES and NNS), script type (short sentences and long sentences), and the four criteria will not be taken into consideration for the time being (see Research questions 2-5). This measurement looks at the raters’ overall behaviour on all scripts and all criteria by assigning a single score to each rater on every script. This score is the sum of their scores on the four criteria.
The MFRM operates by evaluating the significance of each data point in relation to all other data points in a data matrix. This is continued until the value of a data point becomes predictable in light of the other data points (Bond and Fox, 2007; Eckes, 2011). In other words, the model seeks consistent patterns until every individual rating becomes predictable (see McNamara, 1996, p.129 140). Once this process is completed, the MFRM provides useful estimates of various factors involved in the rating process. Some of these estimates and values, like the degree of rater severity, are presented in the rater measurement report (table 5.7). However, it is useful to first explore the Vertical Ruler shown in figure 5.14.

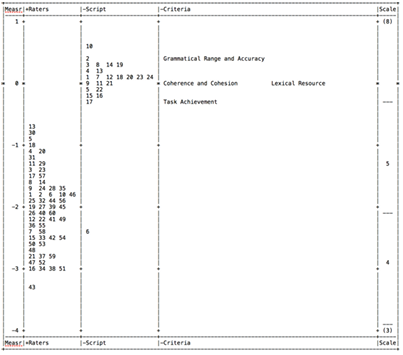
The Vertical Ruler maps the relationship between the severity of raters, the scripts and the relative difficulty of the four criteria of the analytic scale. The first column is the Measure which tells us the logit values of the facets of investigation (rater, script, criteria). The second column is the spread of raters based on their overall severity. The rater spread is set on positive (+), meaning the raters at the top were the most lenient overall while the ones at the bottom were the most severe. Raters can be identified by their numbers; raters 1-30 are NES and 31-60 are NNS. We observe that there is an appreciable spread in their severity degree; Rater 13 (NES), at the top of the spread was clearly more lenient than rater 43 (NNS) at the bottom. How this difference in spread is interpreted will be covered subsequently. The spread is, however, rather similar to the raters in Johnson and Lim (2009).
Script spread was set at negative (-), meaning the scripts at the top of the spread were awarded the lowest marks, whereas those at the bottom were awarded the highest. We see that the spread of scripts was a lot more condensed than raters. This means that all the scripts were written by test takers of similar abilities. As a general rule for proficiency tests, such a spread would be alarming, since a larger variance in test-takers’ abilities is to be expected (Green, 2013). However, all the test takers were of similar ability; they were all placed at the same level according to the placement test at the British Council in Kuwait. There was one script that stood out as a distinct outlier; script 6 (short sentences). This script was awarded much higher scores by all raters. It will be recalled that in the cluster analysis (see previous section), this script was unique to the others and was given its own cluster based on its indices on the Coh-Metrix tool. One wonders at how such a test-taker was placed with the other students at this group level.
The placement test at the British Council-Kuwait is a test of the four language abilities (skills), so it can be surmised that this test-taker’s writing is perhaps a lot more developed than the other three skills (i.e., reading, listening and speaking). With reference to the Rater Measurement Report (table 5.7), the first column (Total score) is the sum of all the scores awarded to all the scripts by the rater. The maximum score here would be 864- that is, 24 (number of scripts) x 36 (the maximum total score if a test taker was awarded a full mark of 9 on each criterion of the analytic scale). The second column (Total count) is the number of data points provided by each rater; number of scripts rated (24) x the number of criteria on the analytic scale (4). This means a total of 96 for every rater. We are primarily concerned with columns 5-11 in table 5.8. Column 5 is the estimate of rater severity measured in logits. It ranges from -.70 (most lenient rater) to -3.25 (most severe rater). The sixth column is the Model Standard Error, which is quite low when considering the large amount of data at hand; each rater had 96 ‘snap-shots’ (24 scripts rated on 4 criteria).
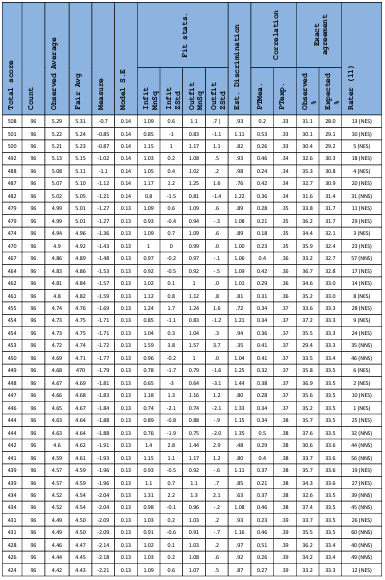


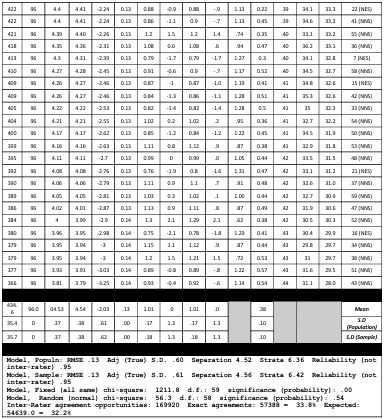
Columns 7-10 are known as the ‘fit statistics’ (or measurement of fit), and are vital for rater training, monitoring and selection (McNamara, 1996). Normally, the Infit Mean Square (MnSq) and Outfit MnSq should range between .5 – 1.5 according to Linacre (2012), but McNamara recommends a more stringent parameter of .75 – 1.25 in higher stakes tests. The ZStd values should fall between +/- 2 (Green, 2013). What these fit statistics tell us is how well raters conformed to the model. An Infit MnSq value above 1.5 (or 1.25 in some cases) points to the rater as being too random (unpredictable), whereas a value below .5 (or .75 in some cases) implies that the rater was too predictable (halo or central tendency effects; see section 2.7.1). According to table 5.8, all the raters in this investigation fit the model, except rater 35 (NNS), who had an Infit MnSq value of 1.59(ZStd 3.8), and an Outfit MnSq of 1.57 (ZStd 3.7). This rater was rather unpredictable in his/her rating patterns. Such raters should not be eliminated based solely on these results, but rather brought in for further training and monitoring (Eckes, 2011). High MnSq’s are generally more of a threat to the scoring process than low ones (Green, 2013).
There were no raters who were shown to be too predictable, though rater 1 (NES) was the most predictable rater in the model with an identical Infit and Outfit MnSq estimate of 7.4 (Infit and Outfit ZStd of -2.1). However, his/her fit statistics were within the acceptable parameters. Table 5.7 displays the raters from the most lenient to the most severe. Therefore, rater 13(NES) is the most lenient rater in this data model, followed by rater 30 (NES), descending to the most severe (rater 43 (NNS)). It can be observed that the top half of the table (the most lenient raters) consists of 23 NES raters and 7 NNS raters. This means that on the whole, the NES were generally more lenient. The 7 NNS raters are the same ones that formed a separate cluster in the cluster analysis, section
5.4.1. Moreover, it is worth highlighting the differences in severity degrees between the 9 most lenient raters, who awarded an average of +5 (out of 9) and the 6 most severe raters, who awarded an average of -4. The difference in severity measurement was 2 logits on average. This means that test-takers who were rated by the 9 most lenient raters had an increased chance, as much as 40%, of achieving a critical score (pass/fail) compared to test-takers who were rated by the 6 most severe raters. In other words, if test-taker A had a 50% chance of being awarded a score of 5 (out of 9) by one of the severe raters, that same test taker’s chances would increase to 90% if he/she was rated by one of the lenient raters. Alternatively, if that test-taker had a 10% chance of being awarded a score of 5 (out of 9), for example, then the chance would increase to 50% under a more lenient rater. It can be seen that test-takers’ chances of achieving a particular score is heavily influenced by the rater who rates the script. Furthermore, there was a difference of nearly one and a half points on average between the most lenient rater (NES 13: Observed average = 5.29) and the most severe rater (NNS 43: Observed average 3.81). This translates to a difference of 2.55 logits.
The Reliability coefficient of the rater measurement model is reported at the bottom of the table. This should not be confused with inter-rater reliability (the traditional understanding of reliability). The reliability estimate reported here is, in fact, estimating the degree to which raters really differed in their severity, not the extent to which they agreed. High reliability estimates here indicate real differences in rater severity that are not due to chance (Green, 2013; McNamara, 1996). The reported estimate is .95, which is extremely high (reliable), meaning the differences in severity were real, and not due to randomness. This estimate is highly significant at p < .001 (chi-square 1211.8, df 59). Furthermore, there were 169,920 opportunities of exact agreement between raters but only 57,388 cases of exact agreement (33.8%). Test-takers’ chances of achieving a critical score can increase by as much as 90% depending on the rater. As a result, we observe much construct irrelevant variance in our test scores. Raters cannot function interchangeably here, and the choice of rater would make a notable difference to the test-taker.
These findings can be complemented by observing the differences between pairs of raters in terms of their severity on specific scripts. This could be investigated using the MFRM by producing a pairwise comparison table. The table compares how pairs of raters scored each script. Two raters’ scores on a given script are evaluated in terms of one rater’s target measure (severity degree in logits) being compared to another rater’s target contrast. Owing to the high number of significant differences found between pairs of raters, the full table of significant results cannot be presented. Bonk (2015, personal correspondence) suggests that these pairwise comparisons are shown to stakeholders as a concrete approach to demonstrating the effect rater variance may have on the scores of a writing test. This approach, according to him, is also much more reader-friendly. The purpose of this table is to demonstrate how pairs of raters significantly differed on each written script. The number of significant differences though will be summarized in 5.8. It can be observed from table 5.8 that, on every one of the 24 scripts, there were numerous pairs of raters who significantly differed in terms of their severity. All of these cases confirm the fact that the score test-takers were awarded on the writing script was a function of their ability (writing proficiency), task difficulty and rater severity. Moreover, numerous, significant differences between raters who share the same L1 (NES/NNS) can be found.
There were 232 cases of significant differences (t =/> 2) between pairs of NES, and 306 cases of significant differences between pairs of NNS on all the scripts. Therefore, differences between raters in terms of their overall severity were not due to their native/non-native status alone. As a rule, any t value =/> 2 is deemed significant (Linacre, 2012). Nearly two thirds of those significant pairwise differences (1253) were on the scripts with long sentences (scripts 13-24) affirming Kobayashi and Rinnert’s (1996) finding that greater disagreement between NES and NNS raters was on scripts that exhibit more NNS features. The scripts with short sentences (1-12) had a total of 809 significant pairwise differences. These significant differences between pairs of raters are summarized in table 5.9.

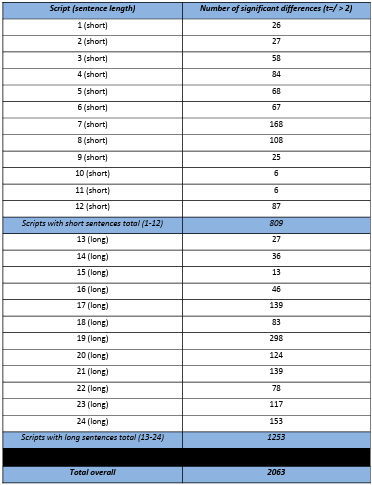
Before concluding this research question, it is worth looking at some of the other tables produced by the MFRM to help further understand the results. Table 5.9 shows how the rating scale functioned. The analytic scale consisted of 9 points- that is, scores range from 1-9. The table shows that scores of 1, 2 and 9 were not awarded. In operational test settings this would be problematic and test developers would consider collapsing the scale. However, knowing that all the test-takers were of similar proficiency helps explain this finding. Clearly none of them produced a script that was poor enough to be awarded a score of 1 or 2, nor did they produce one that was good enough to warrant 9 (out of 9). The only alarming value in table 5.9 is the RASCH-ANDRICH Thresholds Measure. This examines the test-takers who were awarded each score with an expectation that as the scores increase, so too do their ability estimates. So, the Rasch-Andrich Measure value should increase at every score. It does so from score 3 to 4, 4 to 5, 5 to 6, and 6 to 7, but decreases from 7-8. What this means is that test-takers who were awarded scores of 8 were not more able than those who were awarded 7 (out of 9). However, the Quality Average Control Measure does monotonically advance at each score, which is a positive sign. Rating scale development is not the purpose of this investigation, but nonetheless, it is worth pointing out this finding. Such findings cast some doubt on the validity of the ratings as they indicate that the meaning of the rating scale is not clear to the raters (Eckes, 2011). This is not to be totally unexpected as raters had received no training on the use of the scale.

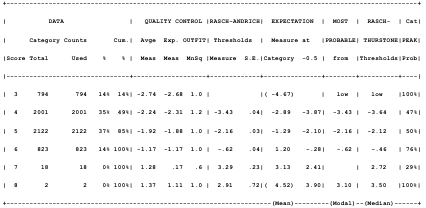
It is also worth examining the script measurement report (table 5.10). This is almost identical to the rater measurement report (table 5.7), except the main focus on the measurements is pertinent to the script and not the rater. The most surprising result in the script measurement report was the Reliability and p value. Even though all the scripts were written by students of the same level, the model found that the differences between the scripts were highly significant (p< .001) and extremely reliable (Separation 6.42, Strata 8.90, Reliability .98). In other words, there was an abundant variation in the writing ability of the 24 students who wrote the essays.

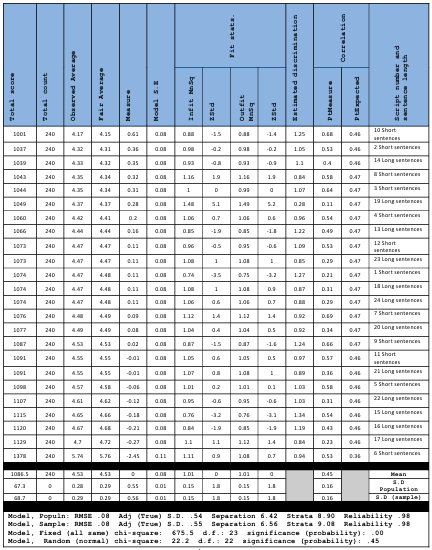
The average score awarded to each script ranged from 4.15 (measure of .61 logits) to 5.76 (measure -2.45 logits). The majority of scores were approximately 4.5 (out of 9). Script 6 (short sentences) was rated the highest, whereas script 10 (short sentences) was rated the lowest. The fit statistics for all the scripts were within the generally accepted parameters of Linacre (2012), but some were not when judged by the more stringent parameters of McNamara (1996). Script 19 (long sentences) had an Infit MnSq of 1.48 which is above McNamara’s 1.25, but just below Linacre’s 1.5 parameter. What this means is that the scores awarded to this script were somewhat inconsistent. However, Linacre (2012) asserts that this does not influence any of the measurements found in the report. Script 1 (short sentences) had an Infit MnSq of .74, which is above Linacre’s parameter of .5, but only just below McNamara’s more stringent level of .75. The lower this number, the more predictable the script was in terms of ratings. That it, according to the MFRM, script 1 (short sentences) was the most predictable script in terms of ratings awarded.
Another useful table worthy of inspection and produced by FACETS, is the Unexpected Response table (figure 5.12). This analyzes the standard residuals- that is, the differences between the observed scores (responses) and expected scores when processing the data (Green, 2013). The default is to report any scores awarded that are =/+3 standard residuals. In other words, it highlights mismatches between the scores raters were expected to award by the model and the scores they actually awarded. Raters are human beings and therefore not expected to behave like robots (Linacre, 2012). Thus, mismatch is something to be expected. However, Green (2013) asserts that testers should be concerned when more than one mismatch for any single rater is detected by the model. Green (2013) asserts that this may be the case of a script triggering an emotional response from the rater that made them react differently when rating the script in question. Raters 18 (NES) and 38 (NNS) both had two unexpected scores, and this proved somewhat problematic. Yet, both raters’ fit statistics (Infit MnSq and ZStd and Outfit MnSq and ZStd) were within the acceptable parameters (see table 5.7). This is something which is worth investigating in a more qualitative manner.

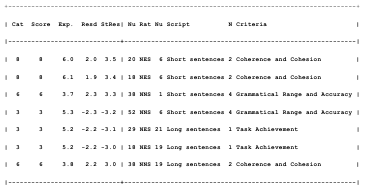
Overall the results in this section illustrate that nearly all the raters’ ‘fit statistics’ were within the acceptable parameters, meaning that each rater was internally consistent and useful for future rater training (McNamara, 1996). However, there was a highly significant difference between raters’ systematic severity degrees (Reliability coefficient = .95, p< .001). The most lenient rater (NES 13) had a logit measure of -.70 whereas the most severe rater had a measure of -3.25 (NNS 43). This finding is not unusual; significant differences in rater severity have frequently been found amongst trained raters who share the same L1 (Eckes, 2005 and 2011; Engelhard, 1992 and 1994; Kondo Brown, 2002; Lumley, 2002; McNamara, 1996; Saeidi et al., 2013; Weigle, 1998). These highly significant differences in severity compromise the scoring validity of writing assessment as they result in much construct-irrelevant variance.
The issue of rater variance and differences in rater severity are further illuminated in the rater pairwise comparisons. Significant differences (t> 2) and highly significant differences (t> 2.5) were found between many pairs of raters, including raters who share the same native status. Thus, choice of rater in this investigation had a discernible influence on the score awarded. One way to circumvent this problem, it has been suggested, is to use the method of multiple-ratings (see section 2.9.1). Two raters rate the same script and the average of their scores is the final awarded score. In the case of a large discrepancy between pairs of raters, a third more experienced rater rates the script (Weigle, 2002). However, the element of chance still persists when following this procedure. Multiple-ratings do not account for systematic rater severity. In this investigation, for example, if any of the ten most lenient raters were paired to score a script and the same script was rated by a pair chosen from the ten most severe raters, there would have been a difference of at least one score between the averages of each pair. In other words, the score a test-taker is awarded on a writing test is not only the product of his/her writing ability, but also luck of the draw in terms of raters (or even pairs of raters). Van Moere (2014) suggests that NES are paired with NNS when scoring writing.
This, he argues, could result in one rater cancelling out the other’s biases. Although this can produce a meaningful score in some cases, the previous problem persists. If a script is rated by NES 13, 30, 5, 18, 4, 20, 11, 29, 3, or 23 combined with NNS 31 or 57 it would most likely result in a score that overestimates the ability of the test-taker. Similarly, if NES 21 or 16 were combined with NNS 43, 51, 38, 34 to rate a script, then the score would, in all likelihood, underestimate the test-taker. Thus, the aforementioned pairings would contribute to major construct-irrelevant variance rather than counter biases. This further illustrates the necessity of implementing MFRM in rater-mediated assessment settings, especially in high-stakes tests (Eckes, 2011; McNamara, 1996). In conclusion, due to the extremely high reliability estimate of our model (.95) (the extent to which raters really differed in their overall severity), and the highly significant p value (p< .001), we reject the null hypothesis and retain the alternative; there is a significant difference (p< .001) in the overall degree of severity for raters who scored the scripts using the analytic scale. This conclusion is supported by the high number of significant differences between pairs of raters found in the MFRM rater pairwise comparisons. Results like these, if found in a high-stakes test, would cast major doubts on the validity of test scores and result in serious consequences for the test-takers. Such findings need to be adequately addressed in Claim 4 of the AUA. These findings mirror those of Engelhard (1992 and 1994), McNamara (1996), Wigglesworth (1993), and Lumley (2002).
It was mentioned at the beginning of this section that these estimates are general ones that do not take into consideration our rater groups (NES and NNS). The scores observed here are the raters’ combined overall scores of the four criteria. The following two sub-questions explore the severity degrees of each group (NES and NNS) individually in order to establish whether there were considerable differences in terms of their overall severity.
5.6.1 Research question 1.1: Is there a significant difference (p< .05) in the overall degree of severity of the NES who scored the scripts using the analytic scale?
H0 There is no significant difference (p> .05) in the overall degree of severity of NES who scored the scripts using the analytic scale.
H1 There is a significant difference (p< .05) in the overall degree of severity of NES who scored the scripts using the analytic scale.
The previous research question analysed the overall severity of raters across all scripts. It was found that there was a highly significant difference between raters in their overall severity degrees (p< .001). Thus, it was concluded that these raters could not function interchangeably and that the choice of rater was not a matter of indifference to the test-taker. However, as evident in the cluster analysis, each group of raters (NES and NNS) exhibited unique scoring patterns. Therefore, it is worth investigating the overall severity degrees of each group individually since the previous analysis may have been muddied by the contradictory scoring pattern of each group. In other words, this sub question and the one that follows seek to establish whether the raters in either group could function interchangeably. To quote Fulcher (2010) once again, these two sub-questions test the unexpressed language test assumption that “whichever rater is making the judgment should be a matter of indifference to the test-taker” (ibid: p.52-53). This is done by investigating the differences in their overall severity degrees in a similar manner to the previous research question.
On examination of the NES Vertical Ruler (figure 5.15), it can be seen that, unlike the Vertical Ruler for all the raters (figure 5.14), the scripts are more spread out. This means that there is a larger variance in the estimated abilities of test-takers who wrote the scripts. We also observe that the criterion, Grammatical range and accuracy, was scored far more leniently here. The criteria Coherence and cohesion and Lexical resource, as in figure 5.14, had an identical measurement and were scored more severely. Contrarily, Green and Hecht (1985) observed that their NES highly agreed when rating the severity of scripts’ ‘organization’, though this agreement was: (a) in relation to error gravity (see section 3.1 and 3.1.2), and (b) not based on any particular statistical procedure. However, Engelhard (1992), who also used the MFRM, also had a contrary finding. His raters had the least difficulty scoring ‘content/organization’. This contrary finding could be due to the assessment setting; the test-takers (writers) were eight-grade students whose L1 was English as opposed to adult EFL test-takers.

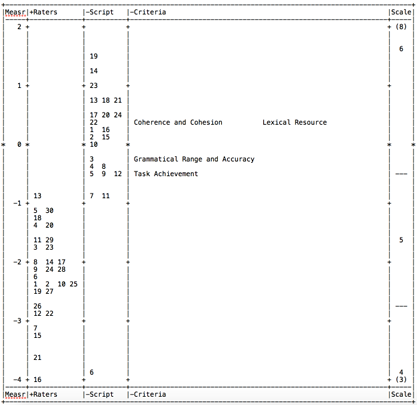
The rating scale functioning report for NES (table 5.12), proved slightly problematic as was previously found to be the case for all raters (Table 5.9). The Quality Control Average Measure shows that the measure decreased from the score of 7 (out of 9) to the score of 8 (2.77 – 2.21). The average shown here should advance monotonically (Eckes, 2011). Even though the Quality Control Outfit MnSq was below 2 for all scores and thus acceptable, the decrease in Average Measure from score 7 to 8 (out of 9) was perturbing. This means essentially that the rating scale, especially the descriptors of scores 7 and 8, was unclear to the raters, thus casting doubt on the scoring validity (Eckes, 2011). Raters have sometimes been found to have difficulty in discerning between scores at the upper end of the rating scale (Chen et al., 2013).

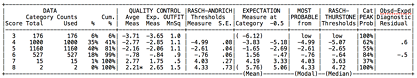
Before analysing the Rater Measurement report, it is worth reporting the unexpected scores found in the model (figure 5.14). This table analyses the standard residuals (difference between observed score and expected score). It can be discerned that there were six unexpected scores, four of which were on the criterion Grammatical range and accuracy. The other two were on the criterion Coherence and cohesion. Four of the scores were on scripts with short sentences, and two were on scripts with long sentences. We also note that rater 30 had two unexpected scores, both of which were lower than expected on scripts with short sentences. We also note that two of the unexpected scores involved script 6, the script with the highest overall scores in this investigation. Both scores were ones that were higher than expected (awarded a score of 8 when the model expected 6.1). This could explain why the Average Measure of the score 8 in the rating scale functioning report (table 5.13) decreased after the score of 7 when normally it would increase as there were only two cases where raters awarded the aforementioned score. Moreover, this highlights Shi’s (2001) observation that NES were more willing to award scores at the extreme end of the rating scale.

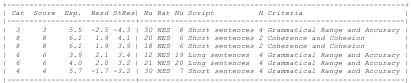
With regard to the NES Rater Measurement Report (figure 5.15), a larger spread in rater severity degrees can be seen. Previously there was a 2.55 logit difference between the most lenient and the most severe rater. The difference between the most lenient NES (rater 13; Measure = -.89) and most severe (rater 16; Measure =4.00) was 3.11 logits. There was an approximate 1 point difference between the average the most lenient three raters awarded and the average of the three most severe raters. The Fit Statistics (Infit: MnSq and ZStd, and Outfit: MnSq and ZStd) were all acceptable (ranging between .5 – 1.5). If a more stringent acceptance level of .75 – 1.25 (McNamara, 1996) was applied, then all but one rater would be within the accepted levels (Rater 30: Infit MnSq= 1.44, ZStd= 2.9, Outfit MnSq= 1.50, ZStd= -1.2). The NES were, therefore, fairly consistent and did not exhibit any recognizable halo or central tendency effects.
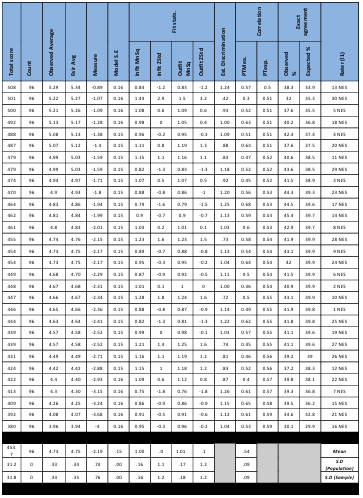


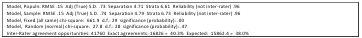
Finally, NES showed an exact agreement of 40.3% which is appreciably higher than when they were combined with the NNS (33.8% exact agreement). Their expected agreement was 38%. When these figures are more or less equal, it indicates that raters are behaving like independent experts (Green, 2013, p.224). However, the exact agreement figures here are slightly higher than the expected ones in this case. This indicates that raters are behaving in clone-like fashion, that is, they are being slightly too predictable (Green, 2013, p.224). Green (2013) states that this is acceptable to some degree since raters are trying to rate as like-minded individuals. Nonetheless, the differences in rater severity between the groups were highly significant (p< .001), much like the NES in previous investigations (Engelhard 1992 and 1994; Lumley, 2005; McNamara, 1996). The reliability index for the differences in NES severity degree was .96, which is extremely high.
This high reliability estimate, not to be confused with traditional reliability concepts, indicates that the differences between NES in terms of their overall severity were real and not simply due to chance (Green, 2013; McNamara, 1996). Similar to research question 1, the MFRM could produce rater pairwise comparisons which identify pairs of raters who significantly differed in their overall ratings of each script. It was noted then that there were 232 significant differences between pairs of NES at the stringent t +2.5. Consequentially, the null hypothesis is rejected and the alternative retained: there is a significant difference (p< .001) in the overall degree of severity of NES who scored the scripts using the analytic scale. The next research sub-question follows an identical format to this one, only it measures NNS degrees of severity.
5.6.2 Research question 1.2: Is there a significant difference (p< .05) in the overall degree of severity of the NNS who scored the scripts using the analytic scale?
H0 There is no significant difference (p> .05) in the overall degree of severity of NNS who scored the scripts using the analytic scale.
H1 There is a significant difference (p< .05) in the overall degree of severity of NNS who scored the scripts using the analytic scale.
Similar to what was seen on the NES Vertical Ruler (figure 5.16), the raters and scripts have a wider spread than the Vertical Ruler for all raters (figure 5.14). What is unique about the NNS Vertical Ruler is the spread of criteria difficulty. Three of the criteria were located just below zero logits but the criterion, Grammatical range and accuracy, was located over 1 logit. This denotes that the probability of an average test-taker achieving a high score on the aforementioned criterion is extremely low. Specifically, there was no rater who had a 50% probability of awarding a score of 6 (out of 9) or more to the criterion. This was contrary to Lee’s (2009) Korean NNS who rated the criterion ‘organization’ most severely.
The NNS in this investigation showed themselves to be extremely severe raters of Grammatical range and accuracy. This was not surprising and was in line with the majority of the previous literature that utilized MFRM (Lee, 2009; Lumley, 2005; McNamara, 1996; Wigglesworth, 1993), and various other studies that observed that NNS were stricter scorers of grammatical features (Davies, 1983; Green and Hecht, 1985; Hyland and Anan, 2006). Kobayashi (1992) was a rare case who found the opposite; NES were more severe raters of grammar. However, her study focused more on teachers as error correctors and feedback providers, as opposed to strictly raters who rate written compositions. Although some studies have found that NNS can be more sympathetic towards scripts
written by test-takers who share their L1 (Hinkel, 1994; Kobayashi and Rinnert, 1996; Land and Whitely, 1989), when it comes to rating the criteria pertinent to grammatical accuracy the NNS tend to be more severe.

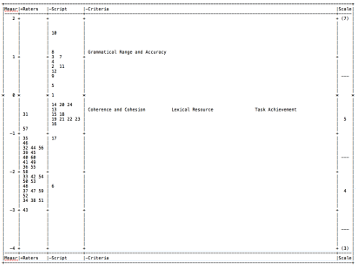
The rating scale, somewhat surprisingly, functioned rather well for the NNS, as seen in Table 5.15. The average measure increases monotonically at each score, and so too does the Rasch-Andrich Thresholds Measure. Once again, the 9-point scale may be collapsed to a5-point scale based on these results, but owing to the fact that test-takers were of similar proficiency it was expected that raters would not use the full range of scores. It is worth pointing out that the most frequent score the NES awarded (the mode) was 5 (40%), whereas the most frequent score the NNS awarded was 4 (35%). This highlights that the NES were generally more lenient raters.

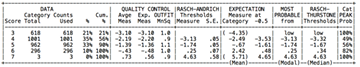
There were considerably more unexpected scores detected by FACETS for the NNS (table 5.16). The NES had 6 compared with the NNS who had 13. Nearly all the unexpected scores were found on the criterion Grammatical range and accuracy. Two other unexpected scores were on the criterion Coherence and cohesion and one was on Task achievement. It is noteworthy that Lexical resource was the only criterion that was not awarded an unexpected score overall by either group of raters. All the NES and NNS raters in Lee’s (2009) study reported that ‘vocabulary’ was the least important criterion on the analytic scale. Moreover, none of the raters in her study were found to have any difficulty scoring the criterion. Kim and Gennaro (2012) also reported that the least amount of rater bias was found on the criterion ‘vocabulary’. On the other hand, ‘vocabulary’ was the most difficult criterion to score for Iranian EFL teachers (raters) (Saeidi et al, 2013).
Two of the unexpected scores were lower than the scores the raters had actually awarded and the remainder of the scores were higher than expected. Like the NNS, the majority of unexpected scores were awarded to scripts with long sentences. Raters 59 and 49 each had two unexpected scores. Unlike the unexpected scores for all the raters (figure 5.12) and the unexpected scores for the NES (figure 5.14), only one unexpected score was awarded to script 6 (the script with the highest overall score). When all of the raters’ scores were analysed together (NES and NNS; figure 5.12) it showed that NNS 52 awarded script 6 a score of 3 (out of 9) when the model had predicted 5.3 to be awarded. However, that should be seen in light of this rater’s behaviour compared with all raters (NES included). When NES were taken out of the model, the score that rater 52 awarded and the score that was expected did not have a +3 difference in the Standard Residuals. Moreover, there were 3 unexpected scores on script 1 (short sentences) on the criterion Grammatical range and accuracy, and 2 on script 12 (short sentences) on the same aforementioned criterion.

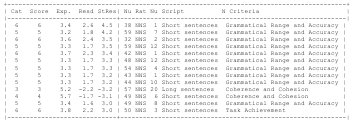
The NNS rater measurement report (table 5.17) shows that the difference in severity between the most lenient rater (NNS 31) and the most severe rater (NNS 43) was 2.49. This is very high, but lower than the NES (3.11) and lower than both groups combined (2.55). This in probability translates to an approximate increase of 45% in achieving a certain score if the most lenient rater were to rate the script. So if the chance of rater 43 (NNS) awarding a score of 4 (out of 9) was at 50%, the chance of rater 31 (NNS) awarding that score would be about 96% (Linacre, personal correspondence). Moreover, their average measure was -1.93, compared to the NES (-2.03) and the overall (-2.19), indicating higher severity degrees. The fit statistics are within the general parameters of .5-1.5, and only one rater (35 NNS) was near the Infit MnSq borderline. In more stringent parameters, like McNamara (1996), of .75-1.25, this rater would be deemed too unpredictable. NNS 31 was the most predictable rater in this group, with an Infit MnSq of .73 and ZStd of -2. In addition, the Exact agreement (38.3%) was slightly higher than the Expected agreement (37.1%), indicating that this rater may have been too predictable even though small increases are deemed acceptable (Green, 2013).
The Reliability estimate- that is, the extent to which differences in rater severity are real and not due to chance, was extremely high (.94). This, along with a highly significant p value (< .001) leads us to reject the null hypothesis and retain the alternative: there is a significance difference (p< .001) in NNS overall severity degrees. This result mirrors the one in the previous sub-question and the main research question (research question 1) and is similar to what Kondo-Brown (2002) found with her three NNS raters.

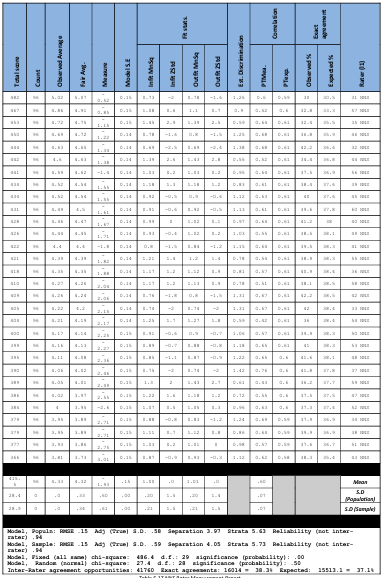
The findings of the previous two sub-questions (Research questions 1.1 and 1.2) mirror the findings of Kim and Gennaro (2012). However, unlike Kim and Gennaro (2012), the NES exhibited more variance in severity than the NNS (NES= 3.11 logits, NNS= 2.58 logits). Nonetheless, this was in line with Shi’s (2001) observation that the NES were more willing to award scores at the extreme end of the rating scale. If one were to implement multiple-ratings, utilizing raters from each group (NES paired with NES and NNS paired with NNS), it would continue to remain problematic. If either of NES 13, 30, 5, 18, 4, and 40 were paired to rate a script, it is highly probable that the score awarded would overestimate the test taker’s writing ability. Similarly, if NES 16, 21, 15 and 7 were paired to rate a script then the score awarded would most likely result in an underestimation. As for the NNS, if raters 31, 57, 35, and 46 were paired to score a script, then the score would, in all probability, be an overestimation.
Conversely, if NNS 43, 51, 38, 34, and 52 were paired, then the score they award would likely be an underestimation. In short, multiple-ratings in all its forms do not eliminate rater variance, and thus construct-irrelevant variance exists in the assessment setting. Finally, the spread of raters on the vertical ruler rater measurement report, appear very similar to the raters in Kim and Gennaro’s (2012) study. That is, the bulk of the raters in the top half (lenient raters) were NES, whereas the majority of the raters in the bottom half (severe raters) were NNS (see also Johnson and Lim, 2009). There were slightly more exceptions in this current investigation owing to the larger number of participants. Kim and Gennaro (2012) included only 17 raters (9 NES and 8 NNS) in their study, whereas this investigation consisted of 60 participants (30 NES and 30 NNS). It was concluded that, owing to the extreme nature of variability in rater severity degrees, the scores obtained by the raters were not very meaningful, useful, or fair. In short, they posed a major threat to the scoring validity.
A summary of the main findings from research question 1 (all raters combined) and its two research sub-questions 1.1 and 1.2 is presented in table 5.18. It can be observed that the findings are very similar. In every measurement, the raters exhibited highly significant differences in severity degrees, and that the raters fit the model in every type of measurement. The largest difference between raters in terms of severity degrees was found with the NES (measure of 3.11 logits). The NNS had 13 unexpected responses (scores awarded), the highest number in all three measurement reports.

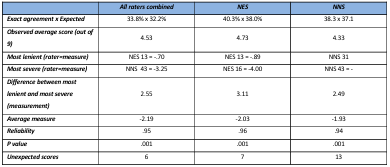
Table 5.18 Summary of the major findings in Research Question 1.
This research question and its two sub-questions looked at raters’ overall scores on all scripts combined. The following research question explores whether an interaction exists between raters and scripts that leads to systematic bias scoring patterns by either group.
5.7 research question 2: Is there a significant bias interaction (t =/> +/- 2) between raters and scripts?
H0 There is no significant bias interaction (t< +/- 2) between raters and scripts.
H1 There is a significant bias interaction (t =/> +/- 2) between raters and scripts.
This research question seeks to identify any bias interaction patterns between the two distinct groups of raters (NES and NES) and the two distinct script types (scripts with short sentences and scripts with long sentences). The previous research question observed raters’ overall behaviour on all scripts and criteria, and found that NES were generally more lenient than the NNS. However, it is likely that raters exhibit systematic sub-patterns of severity towards one type of script (short sentences or long sentences). In other words, the previous research question estimated the influence of rater severity independently. This research question will explore whether an interaction exists between rater and script that yields systematic severe or lenient ratings.
MFRM does this by comparing the residuals (differences between the Observed score and the models’ Expected score), and analysing them for any recognizable sub-patterns (McNamara, 1996). Specifically, the MFRM investigates the systematic interaction between particular raters and particular facets (factors) in the assessment setting. Furthermore, it calculates the residuals for any systematic interaction (or sub-pattern) between raters and scripts and proceeds to analyse the residuals for each rater x script combination found in the data set. There are 60 raters and 24 scripts which total 1,440 interactions (bias terms).
The MFRM will highlight all the significant bias terms (t =/> +/- 2). These significant terms suggest that the script in question is being rated in a systematically more severe (t =/> -2; underestimated), or more lenient (t =/> +2; overestimated) way by the rater in question. For the sake of clarity, these bias terms will then be divided into two groups: overestimations (systematically scored more leniently) and underestimations (systematically scored more severely). The two groups will then be analysed further to determine how many of the bias terms were found by the NES and how many by the NNS. Finally, the number of those terms found in the scripts with short sentences and those found in the scripts with long sentences, for each rater group, will be presented. The overall bias patterns (significant and non-significant) for the NES x script and NNS x script are visually presented in figures 5.17 and 5.18 respectively. The vertical axis is the severity measure, and the horizontal axis displays the 24 scripts. Each coloured line represents a specific rater, and the higher up the line appears on the chart, the more lenient the rater was when scoring the script. The contrasting pattern of each group (NES and NNS) is apparent in both figures. The NES lines generally descend in relation to the horizontal axis. This means they were, on the whole, more lenient when scoring the scripts with short sentences as opposed to the scripts with long sentences. The NNS show the opposite pattern Their lines generally move upwards along the vertical axis, indicating that they were generally more severe when scoring scripts with short sentences, and more lenient when scoring scripts with long sentences.
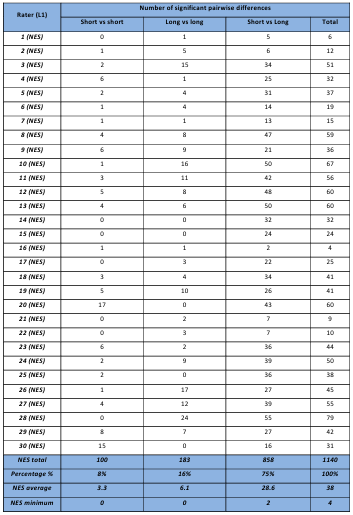


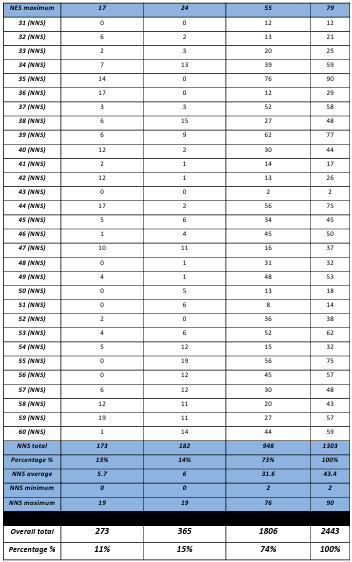
Some of the previous literature found bias patterns when rating scripts that were written by extremely high (or low) ability test-takers (Kondo-Brown, 2002; Schaefer, 2008; Saeidi et al., 2013). Script 6 was the only script that stood out in this investigation as being extremely high (highest rating). A few of the unexpected responses in the previous research question (and its sub-questions) were found on script 6 (see figures 5.12, 5.14 and 5.17), yet very few rater x scripts biases were found on this particular script. There were only significant 3 bias terms that were all overestimations (NES 20 t = 3.04, NES 18 t = 2.88, and NNS 40 t = 2.11). A lot more rater x bias terms were found on scripts 19 (long sentences- 11 terms), script 7 (short sentences- 8 terms), and scripts 23 (long sentences), 24 (long sentences) and 8 (short sentences) which all had 7 statistically significant terms. Additionally, there were no significant rater x script bias terms in 5 of the 24 scripts (scripts 1, 5, and 10 (short sentences); and scripts 15 and 16 (long sentences)).
Much of the literature that compares how NES and NNS score writing, explicitly or implicitly, poses the question of which group is the more lenient (or severe) (Connor-Linton, 1995b; Hinkel, 1994; Hyland and Anan, 2006; Kim and Gennaro, 2012; Kobayashi, 2992; Kobayashi and Rinnert, 1996; Land and Whitely, 1989; Lee, 2009; Shi, 2001). Based on these findings, the answer to the question, as Engelhard (1996) noted, is dependent on other factors, one of which is the script itself. Hinkel (1994) and Kobayashi and Rinnert (1996) and Land and Whitely (1989) found that raters who were familiar with test-takers’ L1 were more appreciative of the L1 rhetorical patterns found in their English writing. Similarly, Johnson and Lim (2008) found some non-significant bias interactions between raters and scripts written by test-takers who share their L1. Kim and Gennaro (2012) also observed that a few of their Asian raters exhibited biases towards scripts written by Asian test-takers. This investigation mirrors those findings as the NES were, on the whole, systematically and significantly more lenient when scoring the scripts with short sentences (a feature of English writing).
The NNS, on the other hand, were generally more lenient when scoring scripts with long sentences (a feature of Arabic writing). The bulk of the NES overestimations were on scripts with short sentences and most of their underestimations were on scripts with long sentences. The NNS displayed the reverse pattern; most of their systematic significant underestimations were on scripts with short sentences and the majority of their overestimations were on the scripts with long sentences. Due mainly to the small number of raters, previous MFRM investigations found no clear rater x script bias patterns (Eckes, 2012; Johnson and Lim, 2009; Kondo-Brown, 2002; Saeidi et al., 2013; Schaefer, 2008). A much clearer pattern has emerged in this investigation owing to the large number of raters.
In summary, 13.3% of the bias terms between rater and script were statistically significant (t =/> +/- 2). The NES generally overestimated the scripts with short sentences (31 statistically significant bias terms) and underestimated the scripts with long sentences (53 statistically significant terms). That is to say, they systematically scored the scripts with short sentences more leniently that the scripts with long sentences. The NNS, on the other hand, exhibited the reverse pattern; the majority of their overestimations (51 statistically significant bias terms) were on the scripts with long sentences, and the bulk of their underestimations (29 statistically significant terms) were on the scripts with short sentences. This finding was highlighted further in the pairwise comparisons. As a result, we reject the null hypothesis and retain the alternative; there is a significant bias interaction (t> +/- 2) between raters and scripts. The next research question, similar in format to this one, seeks to establish whether there is a significant bias interaction between raters and the four criteria of the analytic rating scale.
5.8 research question 3: Is there a significant bias interaction (t> +/- 2) between raters and criteria?
H0 There is no significant bias interaction (t< +/- 2) between raters and criteria.
H1 There is a significant bias interaction (t> +/- 2) between raters and criteria.
This research question is identical in structure to the previous one, except it looks at the bias interaction between raters and criteria, as opposed to raters and script. All the statistically significant bias terms (t> 2) will be presented in figure 5.21. A bias interaction line chart is presented in figure 5.20. The vertical axis is the severity measure while the horizontal axis is representative of all the raters (some of the names have been collapsed on grounds of economy). Each line represents one of the four criteria. The vertical axis is set at (-), meaning lines rising above the zero mark are cases of severity, whereas lines below the zero mark are cases of leniency.

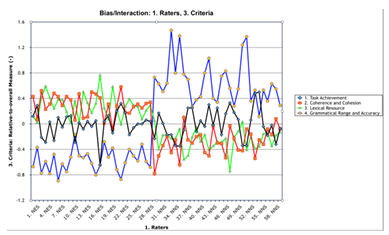
This figure further demonstrates the contrasting bias patterns of each group (NES and NNS). The left half of the chart shows the NES and on the right are the NNS. The most striking line is the Grammatical range and accuracy line. For the NES it is below zero, whereas there is a marked rise above zero on the NNS side of the figure. This tells us that the NES were, on the whole, more lenient when scoring the criterion Grammatical range and accuracy, whereas the NNS were generally more severe. The remainder of the rater x criteria interactions is comparable although it can be observed that the NNS were slightly more lenient when scoring the criterion Coherence and cohesion. As to the MFRM bias analysis, there were a total of 240 bias terms (60 raters x 4 criteria), of which 44 (18.3%) were found to be statistically significant (t > +/- 2). That is to say, there were 44 terms that suggest that the criterion in question is being rated in a systematically more severe (or lenient) way by the rater in question.
The highest statistically significant bias terms were found under the criterion Grammatical range and accuracy (33 terms; 75%). Nearly half of them were overestimations (18 terms; 54.5%) and the remainder were underestimations (15 terms; 45.5%). All the overestimations were by the NES and all but one of the underestimations were by the NNS. Rater 30 was the only NES rater who systematically underestimated the criterion. This finding is not too surprising as raters in general (NES and NNS) have a tendency to exhibit higher bias pattern, namely systematic underestimation, towards criteria pertinent to grammar (Lumley, 2002 and 2005; McNamara, 1996; Wigglesworth, 1993), even when they are explicitly instructed to downplay grammar (McNamara, 1996). Coherence and cohesion was the criterion with the second highest number of significant bias terms (6 terms; 13.6%). Four of those terms were overestimations, (66.6%) and 2 were underestimations (33.4%).
All the underestimations were by NES raters, and only one NES rater overestimated the criterion (25% of the overestimations). All the NNS raters found in the statistically significant bias terms overestimated the criterion (3 terms; 75%). Lexical resource had 4 statistically significant bias terms, 2 were overestimations (50%), and 2 were underestimations (50%). Both overestimations were by NNS, whereas both significant underestimations were by NES. Finally, Task achievement showed only one statistically significant bias term, which was an overestimation by an NES rater. There was a higher percentage of statistically significant bias interaction terms between rater x criteria than rater x script (18.3% and 13.3% respectively). However, the bias pattern is less clear in this research question. Kondo-Brown (2002), Schaefer (2008) and Eckes (2012) all similarly found that raters would be harsher on some criteria but then compensate for it by being lenient on other criteria. In addition, Kim and Gennaro (2012) found that most the significant rater x criteria bias interactions was with NNS, and nearly all were underestimations. In this investigation there were slightly more native raters who exhibited significant biases towards certain criteria (NES = 25 significant terms; NNS = 19 terms), though the NNS were much like those in Kim and Gennaro’s study in that they had more underestimations (NNS = 14 significant underestimations; NES = 5).
It should be noted that all the NNS underestimations were on the criterion Grammatical range and accuracy. Finally, contrary to these findings, Johnson and Lim (2009) and Saeidi et al (2013) both found more significant rater x script (test-taker) bias terms (24 terms) than rater x criteria (13 terms). In truth this is what I expected; that there would be a higher percentage of rater x script bias terms than rater x criteria, especially considering the contrasting script types in this investigation. Even though Barkaoui (2010) believes that the criteria on the rating scale may cause the greatest variance in writing test scores.

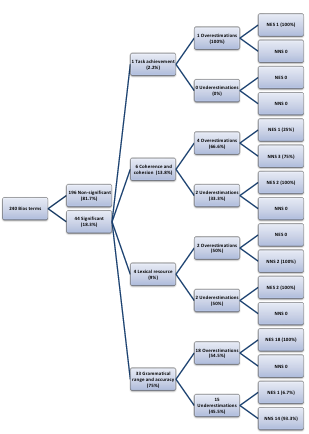
As was the case with the previous research question, this analysis could also be extended to include pairwise comparisons of rater x criteria to show how two pairs of raters significantly differed in their severity on each criterion. However, for reasons of brevity these results will only be summarized in table 5.21

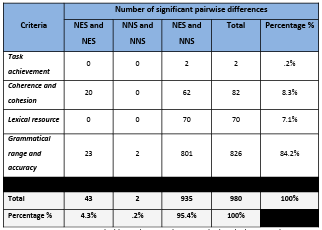
The criterion Task achievement, was the least problematic as there were only two pairwise comparisons that were statistically significant at the more stringent t > 2.5; NES 17 x NNS 54 respectively (which represented only .2% of the significant pairwise differences). If we were to include t values =/> 2, then there would be 27 significant pairwise comparisons. These few differences nonetheless continue to pose a threat to the validity of test scores. Grammatical range and accuracy had the largest number of significant pairwise differences. There were 826 significant differences at the stringent t =/> 2.5 (over 84% of the significant pairwise differences), and 853 significant differences between pairs of raters at t =/> 2. None of the NNS showed a significant pairwise difference at either t value (t =/> 2.5 or t =/> 2) except on the criterion Grammatical range and accuracy (2 significant pairwise differences). There were, however, significant NES pairwise differences, namely, over two thirds of the NES differed significantly from NES 30 when rating Grammatical range and accuracy. The remaining significant pairwise differences were between NES and NNS where NES were significantly more lenient when scoring the criterion. The criterion Coherence and cohesion had 82 significant pairwise differences at the stringent t =/> 2.5 (a little over 8% of the significant pairwise differences), and 249 significant pairwise differences at the t =/> 2. Of the more stringent significant pairwise differences, as noted above, nearly two thirds of the NES differed significantly from NES 30. There were no statistically significant differences between pairs of NNS (t =/> 2.5) except the 2 on the criterion Grammatical range and accuracy.
The remainder of the significant pairwise comparisons were between NES and NNS. Finally, the criterion
Lexical resource had 70 significant pairwise differences at the stringent t =/> 2.5 (which accounted for 7% of the significant pairwise differences), and 186 significant pairwise differences at t =/>2. All the stringent (t =/> 2.5) differences were exclusively between NES and NNS. There were more significant bias interactions between rater x criteria than rater x script, confirming Barkaoui’s (2010) finding that the rating scale had the largest influence on raters’ ratings. In our investigation 18.3% of the interactions between rater x criteria were significant (t> 2). Not surprisingly, the majority of those significant interactions were found on the criterion Grammatical range and accuracy. This finding seems to be constant in the literature (Connor-Linton, 1995b; Kim and Gennaro, 2012; Lee, 2009; Lumley, 2005; Schaefer, 2008; Shi, 2001; Wigglesworth, 1993), in spite of explicit training and instruction that grammar should be downplayed (McNamara, 1996). The criterion Lexical resource had very few significant interactions between the rater and the criterion (only 4 interactions), which mirrors the finding of Kim and Gennaro (2012) and is in line with Lumley (2005, p.207), though Iranian raters in Saeidi et al (2013) found the opposite.
The difficulty experienced by raters when scoring the criterion Grammatical range and accuracy is further illuminated in the pairwise comparisons. There were 826 highly significant differences between pairs of raters (t> 2.5) on the criterion, and unlike the rater x script pairwise comparisons, nearly all these significant differences are between NES and NNS. Moreover, only two pairs of NNS raters significantly differed in their ratings, whereas NES 30 significantly differed with 24 fellow NES on the criterion. This rater scored Grammatical range and accuracy in a very non-native fashion and merits further investigation. These findings further highlight the need for the implication of MFRM in rater-mediated assessment settings and training so that cases similar to the aforementioned could be detected and delt with. At first glance, one may assume that since there were very few significant differences between pairs of NNS, it follows they were rating in a ‘like-minded manner’ (Wolfe et al.,
1998). However, what this result really signifies is that because NNS are so systematically and consistently severe in their rating of Grammatical range and accuracy, hardly any pairing of raters were radically different. This is evident when comparing their scores to the NES and the notable differences between pairs of NES and NNS.
Thus, pairing two NNS to score any script would generally result in a systematic and significant underestimation of a test taker’s ability, even though their inter-rater reliability estimates may be extremely high. It may be tempting to implement Van Meore’s (2014) suggestion of pairing NES with NNS to counter such biases. However, it was noted that NES 30 behaved in a very non-native manner when scoring the criterion and, as a result, if he/she were paired with any NNS, then the likely outcome would be an underestimation of the test taker’s ability. Moreover, the NES and NNS varied in their severity (or leniency) degrees when scoring the criterion. Thus, it is plausible that a very lenient native rater could be paired with a very lenient non-native rater to rate a written script. That same script would receive a different score if a more severe native rater was paired with a more severe non-native rater. Therefore, pairing NES with NNS may eliminate some bias, but it does not contribute as greatly to a validity argument as would the implementation of the MFRM. The MFRM can take into account the severity degree of each individual rater from a pair and contribute much more to Claim 4 of the AUA. Likewise, complementing rater training with such reports (rater measurement report, bias analyses, pairwise comparisons) would contribute to more consistent rating, even if biases are not totally eliminated (Johnson and Lim, 2008; Weigle, 1998).
In conclusion, the statistical bias terms found in this analysis lead us to retain the alternative hypothesis; there is a significant bias interaction (t> 2) between raters and criteria. The first research question looked at the influence of rater severity as an independent facet on the rating process. The following two questions look at the interaction between rater x script, and rater x criteria respectively. The next section extends the interaction analysis even further by analysing the interaction between all three facets: rater x script x criteria.
5.9 Research question 4: Is there a significant bias interaction (t> +/- 2) between raters, scripts, and criteria?
H0 There is no significant bias interaction (t< +/- 2) between raters, scripts, and criteria.
H1 There is a significant bias interaction (t> +/- 2) between raters, scripts, and criteria.
The previous three research questions looked at rater severity independently, the interaction between rater severity and scripts and the interaction between rater severity and criteria. For the latter two, a two-way bias interaction analysis (rater x script and rater x criteria respectively) was run by the FACETS program. The first bias interaction (rater x script) analysed raters’ scores on each script by totalling their scores on all four criteria irrespective of their scores on each criterion, whereas the second bias interaction (rater x criteria) analysed raters’ total scores awarded on each criterion irrespective of individual scripts.
The problem here is that the model did not take into account that the total score was the sum of four independent scores. To illustrate this point, if a rater awarded all four criteria 5 (out of 9), and another rater awarded scores of 7, 3, 7, 3 on the four criteria, then the model treats them as equals; both awarded a score of 20 (out of 36). The same applies to the interaction of rater x criteria; the model calculates each rater’s total score on every criterion, regardless of their scoring pattern of individual scripts. This is done by summing up the rater’s score on each criterion on all 24 scripts. Were a rater to award all the scripts a score of 5 (out of 9) on a given criterion, e.g. Task achievement, then the total score for that rater on the criterion Task achievement would be 120 (out of 216- that is, 5 x 24). Another rater may award all the scripts with short sentences a score of 7 (out of 9) and all the scripts with long sentences 3 (out of 9) which would result in an identical total to the previous rater (120 out of 216). The MFRM would fail to detect these patterns in a two-way bias interaction analysis. Although these two bias interaction analyses are useful in painting an overall picture of rater behaviour, they are not sufficient by any means.
This research question will overcome those limitations by extending to a three-way bias interaction analysis looking at the interaction between three facets of interest simultaneously (rater x script x criteria). This research question will be broken down into four sub-questions matching the criteria of the analytic scale. Under each sub-question, the statistically significant bias terms only of (rater x script x criteria) (t> +/- 2) will be presented in a table. These tables will contain information about the rater, the script, the observed score, the models’ expected score, the bias size and the t value. The larger the bias size and the larger the t value the more significant the interaction. Bias sizes and t values that are negative indicate a systematic underestimation (severe rating) where the observed score is lower than the expected score of the model, whereas positive values with an observed score higher than the expected score illustrate overestimation (lenient rating).
5.9.1 Research question 4.1: Is there a significant bias interaction (t> +/- 2) between raters, scripts, and Task achievement?
H0 There is no significant bias interaction (t< +/- 2) between raters, scripts, and Task achievement.
H1 There is a significant bias interaction (t> +/- 2) between raters, scripts, and Task achievement.
There were a total of 21 significant bias terms between rater x script x Task achievement. Only two were underestimations (rated in a systematically more severe manner) whereas the remainder were overestimations (systematically more lenient). All these statistically significant bias terms (t> +/- 2) are presented in table 5.22.
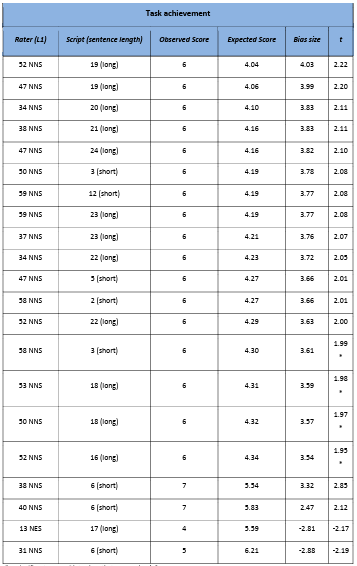

*Borderline significant cases with t values that are nearly +/- 2.
Table 5.22 Rater x script x Task achievement significant bias interactions.
All but one of the significant bias interactions involved NNS. They were all systematic overestimations, except for the interaction of NNS 31 x script 6 (short sentences) x Task achievement. The only significant interaction involving a native speaker was NES 13 x script 17 (long) x task achievement, with a systematic underestimation. Thirteen of the significant bias terms were on scripts with long sentences, whereas eight were on scripts with short sentences. Moreover, script 6 (short sentences) had the highest number of bias terms (raters 38 NNS/40 NNS/31 NNS x script 6 (short sentences) x Task achievement). This script was awarded the highest scores, and results like these suggest that raters usually exhibit bias when rating students of extreme ability (Eckes, 2012; Kondo-Brown, 2002; Saeidi et al, 2013; Schaefer, 2008). Scripts 3 (short sentences), 18 (long sentences), 19 (long sentences), 22 (long sentences), and 23 (long sentences) showed two significant bias interactions with various raters on that criterion. The score of 6 was observed 17 times which were overestimations resulting in scores at least one and a half marks higher than expected.
In the previous research question (Research question 3), the bias interaction of rater x criteria found only two significant interactions between a rater and the criterion Task achievement. That was due to the fact that the MFRM, in the two-way bias interaction, analysed the interaction between rater and criteria regardless of script type. Once the model factored script type along with rater and criteria, a much clearer picture emerged of the biases raters had exhibited, though, much like Kondo-Brown (2002), Johnson and Lim (2009), Eckes (2012), Kim and Gennaro (2012) and Saeidi et al (2013), no discernible pattern emerged. The NNS generally overestimated the criterion Task achievement, but it was not in relation to any script in particular (12 overestimations for scripts with long sentences and 7 for scripts with short sentences).
In light of these results, we retain the alternative hypothesis: there is a significant bias interaction (t> +/- 2) between raters, scripts and Task achievement. The following section will analyse the interaction between raters x scripts x Coherence and cohesion.
5.9.2 Research question 4.2: Is there a significant bias interaction (t> +/- 2) between raters, scripts and Coherence and cohesion?
H0 There is no significant bias interaction (t< +/- 2) between raters, scripts, and Coherence and cohesion.
H1 There is a significant bias interaction (t> +/- 2) between raters, scripts, and Coherence and cohesion
With regard to the interaction between raters x script x Coherence and cohesion, there were 16 statistically significant bias terms (table 5.23). Nearly all of these significant terms, like the previous sub-question, were found in the NNS who awarded a score of 6 (out of 9), when it was predicted that they would award a much lower score. Moreover, all the scripts were ones with long sentences, except for scripts 3 and 6. Script 6 (short sentences), which was awarded the highest scores in this data set, was the only script that was underestimated (rated to a systematically more severe degree). The Observed score was, surprisingly, 4 whereas the expected score was 5.7 (out of 9). This once again illustrates how raters can be systematically more severe when scoring test-takers with extremely high abilities. Script 3 was the only script with short sentences that was overestimated and was done so by rater 26 (NES). In addition, rater 53 (NNS) had a statistically significant bias on script 18 on both this criterion and the previous one. When the interaction of rater x criteria was analysed without script type, there were only 6 significant interactions; 4 overestimations and two underestimations. Finally, it is worth noting that script 6 (the highest ability) once again received an significant underestimation (by NES 49), further adding to the anecdotal evidence that raters exhibit more biases with test-takers of extreme abilities (Eckes, 2012; Kondo-Brown, 2002; Saeidi et al, 2013; Schaefer, 2008).
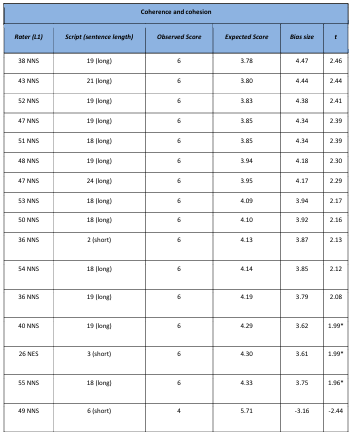

*Borderline significant cases with t values that is just +/- 2.
Table 5.23 Rater x script x Coherence and cohesion significant bias interactions.
A clearer bias pattern emerged in this sub-question, compared to the previous one. The NNS generally overestimate the criterion Coherence and cohesion when scoring scripts with long sentences. This was in contrast to the Korean raters in Lee’s (2009) study. These findings lead us to reject the null hypothesis and retain the alternative: there is a significant bias interaction (t> +/- 2) between raters x script x Coherence and cohesion. The following section will analyse the interaction between raters x scripts x Lexical resource.
5.9.3 Research question 4.3: Is there a significant bias interaction (t> +/- 2) between raters, scripts, and Lexical resource?
H0 There is no significant bias interaction (t< +/- 2) between raters, scripts, and Lexical resource. H1 There is a significant bias interaction (t> +/- 2) between raters, scripts, and Lexical resource. The least amount of significant bias interactions between rater x script x criteria were found on the criterion Lexical resource. There were only 10 significant interactions, all of which were with NNS (total of 7 raters). However, what was surprising in this analysis was the fact that over half of the overestimations were by NNS on scripts with short sentences. The only underestimation on this criterion was once again, like the two previous sub-questions, found on script 6 (short sentences) with rater 53 (NNS), thus offering further proof that raters tend to underestimate students of higher abilities as suggested by some researchers (Eckes, 2012; Kondo-Brown, 2002; Saeidi et al, 2013; Schaefer, 2008). Furthermore, 3 of the NNS had two bias terms on this criterion (raters 53, 54 and 58). Rater 53 (NNS) also had a bias term on the previous two criteria, but the bias in that incident was on script 18 (long sentences). Rater 54 (NNS) was systematically more lenient, scoring scripts 1 and 2 (short sentences) on this criterion whereas in the previous research sub-question, he overestimated script 18 (long sentences).
Finally, rater 58 (NNS) overestimated two scripts with short sentences on this criterion (scripts 3 and 5). He/she also overestimated a script with short sentences (script 2) on the criterion task achievement. This rater is clearly behaving in a manner at odds with the other NNS. In the previous research question, only 4 significant bias terms rater x criteria were found. Like research sub-question 4.1, no clear bias pattern emerged in this sub question (see Kondo-Brown, 2002; Johnson and Lim, 2009; Eckes, 2012; Kim and Gennaro, 2012; Saeidi et al., 2013). These small biases could be due to a belief that, like the native and non-native raters in Lee’s (2009) investigation, ‘vocabulary’ is the least important criterion on the analytic scale. These results are presented in table 5.24.
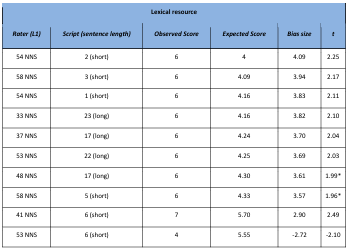

*Borderline significant cases with t values that is just +/- 2.
Table 5.24 Rater x script x Lexical resource significant bias interactions.
In conclusion, the results reported in this section lead us to reject the null hypothesis and retain the alternative: there is a significant bias interaction (t> +/- 2) between raters, scripts and Lexical resource. The next research sub-question will explore the interaction between rater x script x Grammatical range and accuracy.
5.9.4 Research question 4.4: Is there a significant bias interaction (t> +/- 2) between raters, scripts, and Grammatical range and accuracy?
H0 There is no significant bias interaction (t< +/- 2) between raters, scripts, and Grammatical range and accuracy.
H1 There is a significant bias interaction (t> +/- 2) between raters, scripts, and Grammatical range and accuracy.
There were an equal number of significant bias terms between rater x script x criteria on the criterion Grammatical range and accuracy as there were on Task achievement. Of the 21 significant terms in total, 15 were overestimations (systematic leniency) and 6 were underestimations (systematic severity). Eighteen of the significant terms were on scripts with short sentences and 3 were on scripts with long sentences. Eleven of the interactions involved NES and ten involved NNS.
This criterion exhibited the highest number of NES significant terms. On all the other criteria, few, if any of the bias terms involved NES. Another contrasting finding here is that all the underestimations (significant systematic severity) were by NNS on script 6. Once again, this script was awarded the highest scores in this data set. Clearly, NNS have underestimated a test-taker with high abilities in this analysis, supporting what was found in the previous 3 sub-questions and what the likes of Kondo-Brown (2012), Eckes (2012) Saeidi et al (2013) and Schaefer (2008) noted. Only four NNS overestimated scripts on this criterion, and all their overestimations were, surprisingly, on scripts with short sentences. Of those four NNS who overestimated the scripts with short sentences, only one had significant bias terms in the other sub-questions. Rater 38 (NNS) had a significant
overestimation of script 19 (long sentences) on the criterion Coherence and cohesion, and a significant overestimation of script 21 (long sentences) on the criterion Task achievement. It is worth noting that all the Observed scores for the overestimation terms were 6 (out of 9), whereas all the underestimations were 4 (out of 9). Also, this criterion had the largest t value (2.56) (rater 38 (NNS) x Scripts 1 (short sentences) x Grammatical range and accuracy).
Finally, the highest number of bias interactions in the two-way analysis of rater x script (research question 3) was found on the criterion Grammatical range and accuracy (33 significant terms). This was the only case where there were more significant interactions in the two-way analysis (rater x criteria) than the three-way analysis (rater x scripts x criteria). This gives emphasis to the problem raters faced, based on the MFRM, when scoring Grammatical range and accuracy in this investigation much like raters did in other studies (Lee, 2009; Lumley, 2002 and 2005; McNamara, 1996; Wigglesworth, 1993). Lee (2009), for instance, found that the majority of non-native raters reported difficulties in rating ‘grammar’. Moreover, non-natives do tend to be more severe when rating criteria pertinent to form and accuracy, whether it is in their evaluation of erroneous sentences (Davies, 1983; Hughes and Lascaratou, 1982; James, 1977; Sheory, 1986), or their evaluations of grammatical errors in scripts (Green and Hecht, 1985; Hyland and Anan, 2006). The main bias interaction results pertinent to this research question are presented in table 5.25.
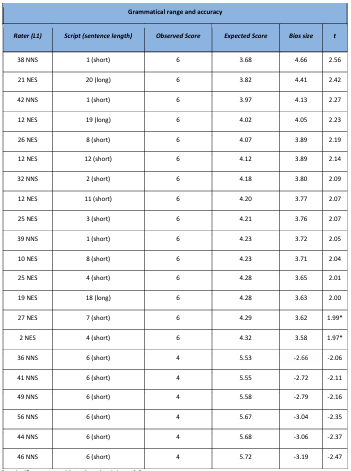

*Borderline significant cases with t values that is just +/- 2.
Table 5.25 Rater x script x Grammatical range and accuracy significant bias interactions
In short, the bias terms found in this analysis lead us to reject the null hypothesis and retain the alternative: there is a significant bias interaction (t> +/- 2) between raters, scripts, and Grammatical range and accuracy. This research question with its four sub-questions found that there were significant bias terms between rater x script x all four criteria. In total there were 68 significant bias interactions: 58 overestimations (scores significantly higher than expected) and 10 underestimations (scores significantly lower than expected). The NES had 13 significant bias terms, 11 of which were on Grammatical range and accuracy. This criterion was clearly the most problematic to raters in this investigation. The NNS had 55 bias terms; of which 9 were significant underestimations (awarded
score much lower than expected). As far as discernible bias patterns is concerned, the clearest pattern was found in the interaction between non-native raters x scripts with long sentences x Coherence and cohesion. In an argument approach to validation (Bachman and Palmer, 2010; Kane, 2006; Weir, 2005), such biases need to be accounted for if test results are to have any meaning or usefulness.
One of the advantages of MFRM is that it not only measures the effect of various facets to the assessment setting, like rater severity and rating scale criteria, it also looks at the interaction between facets (Barkaoui, 2014; Eckes, 2011; McNamara, 1996). The interaction of facets effect has been found to be greater than the effect of independent facets (In’nami and Koizumi, 2015). This was certainly the case in this investigation. Many more significant bias interactions were found when the model factored rater x script x criteria. Both task achievement and Grammatical range and accuracy had the lion’s share of significant interactions (21 significant interactions each). It is common to find more biases of rater x grammar (Lee, 2009; Lumley, 2002 and 2005; McNamara, 1996; Wigglesworth, 1993). McNamara (1996) found that even when raters were explicitly instructed that the writing test was communicative in nature and that grammar should be downplayed, they nonetheless exhibited significant bias towards the criterion. He noted that raters were unaware of how grammar was largely influencing their ratings. One wonders how much of an influence this may have had on the other three criteria. Though the raw scores and MFRM results did not seem to indicate that the raters exhibited any kind of halo effect.
It has also previously been suggested that raters tend to exhibit biases when rating students of extreme abilities (Kondo-Brown, 2002; Schaefer, 2008; Saiedi, 2013). Script 6 (short sentences), which was undoubtedly the highest scored script, received more bias interactions than any other script (12 significant interactions) and had the highest number of systematic underestimations (9 cases of t < -2). These findings attest to the observation that raters tend to exhibit more biases when rating test-takers of higher abilities. There were no scripts that stood out clearly as having been written by extremely low ability students, so no biases of raters x lower ability test-takers were found. The findings in this research question (and its sub-questions) demonstrate how large variances in scores could be due to factors unrelated to test-takers’ writing ability. This variance contributes to construct-irrelevant variance, and is a major threat to validity. The most useful available method today to overcome this problem is by implementing the MFRM in rater-mediated assessment settings. All other solutions, like multiple ratings, combining natives and non-natives, establishing high inter-rater reliability estimates, etc., do not deal with the issue adequately.
5.10 Interviews I.
The first set of interviews were conducted with seven raters (four NNS and three NES) who each scored four scripts (two with short sentences and two with long sentences). However, these interviews were conducted several months after they scored the scripts. Moreover, their original scores could not be traced back to them, since they were submitted in enclosed anonymous envelopes. In addition, the interviews were too short (8-15 minutes), there was very little interviewing technique (e.g., probing) deployed to extract raters’ beliefs, and the analysis was too limited. For these reasons, the results of this section were not very satisfactory, and a new set of interviews were later conducted to overcome some of these limitations (see next section). Therefore, the results of this phase will not be covered in great detail.
In short though, raters in these interviews generally referred to the rating scale in general or to specific criteria on the rating scale to explain why they awarded certain scores. They also spoke a lot about the clarity of the ideas, comprehensibility, mother tongue interference, and other personal criteria that was not related to the rating scale (e.g., creativity, originality, better ideas, etc.). Furthermore, none of the raters felt that sentence length per se influenced the scores, and those who criticized the long sentences felt they were simply badly punctuated. As previously stated, these results were not at all satisfactory and a new set of interviews were conducted to get a better idea of whether sentence length had an influence of the scores raters awarded. The next section covers the second set of interviews.
5.11 Interviews II.
The findings and analysis of the previous seven interviews was not sufficient owing to a number of reasons. One of the methodological limitations was that raters’ scores could not be traced back to them, and as a result the interviews were not structured on rater bias interactions, but rather basic raw scores of only four scripts. Understanding why raters exhibited systematic bias towards certain scripts, and whether sentence length was a factor is a lot more fruitful than analyzing why they awarded raw scores (which may or may not exhibit bias interactions). Shedding light on this matter will contribute to: (a) a better understanding of the quantitative findings of the previous sections, (b) more intelligible future suggestions and implications for rater training and/or teacher certification in Kuwait, and (c) more meaningful suggestions to the Ministry of Education in Kuwait in relation to their current end-of-term high school (secondary school) English exams.
Other weaknesses in the previous seven interviews were: (a) the short duration of the interviews which resulted in data that was too limited to explore and analyze, (b) poor interviewing techniques such as unconsciously approaching the questions with predetermined answers with very few attempts to probe into what raters may have believed, and (c) unsatisfactory coding and analysis of the interview data.
Thus, a decision was made to extend the investigation and conduct a new set of interviews that would enable me to qualitatively investigate the reasons raters exhibited biases when scoring certain scripts, and ascertain whether sentence length was a factor. These new interviews, moreover, were analyzed using NVivo (a computer-aided qualitative data analysis software). A total of 14 new raters (10 NNS and 4 NES) agreed to take part in the second round of interviews. This time, they were asked to score 12 of the 24 scripts that were scored previously in the quantitative part of this investigation (six of which had short sentences and six with long sentences) in one session at their schools. The 12 scripts were chosen based on their ability measure which was reported in the script measurement report (see table 5.10). Each script was paired with another from an opposing sentence length, i.e., a script with short sentences was paired with a script with long sentences that had a similar ability measure. These 12 scripts, their pairings, and a summary of their content are displayed in table 5.26.Immediately after scoring the 12 scripts, their scores were entered into the FACETS software and all their significant (t > +/- 2) (Eckes, 2010) rater x script, and rater x script x criteria bias interactions were identified. The interviews were then structured around their overall scores and most notable bias terms. Raters were asked about individual scripts and also to draw comparisons with other scripts, namely the scripts’ pairings based on the Person measurement report.
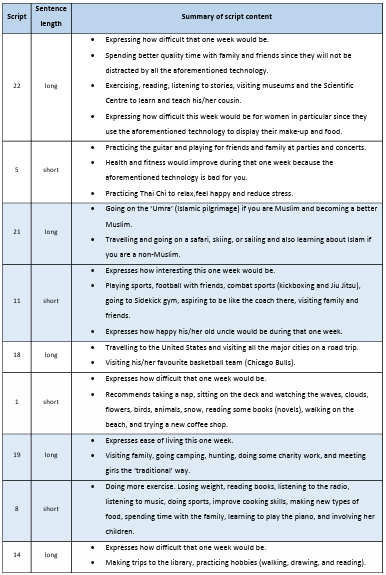


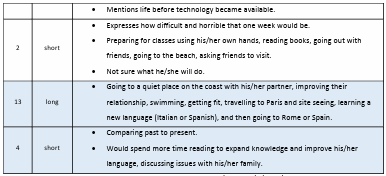
All the significant bias terms (t > +/- 2) found after 14 interviews are presented in Appendix 42 (the shaded rows are the overestimations). These include a two-way bias analysis (the rater x script bias interactions) and a three-way analysis (the rater x script x criteria interactions) on scripts with short sentences and scripts with long sentences. These bias analyses investigate how constant rater severity degrees were across all the scripts. In other words, it examines whether a rater(s) was systematically more severe (underestimation) or lenient (overestimation) than expected when rating one type of script (short sentences or long sentences). The two-way bias analysis (rater x script) explores whether raters overestimated (were significantly more lenient) or underestimated (significantly more severe) on any script on the whole by analyzing the sum of scores from all four rating scale categories combined (i.e., the score of Task achievement + Coherence and cohesion + Lexical resource + Grammatical range and accuracy). The three-way analysis (rater x script x criteria), on the other hand, investigates whether raters overestimated or underestimated a particular criterion from the rating scale on any script.
Generally speaking, there were more significant bias terms in total (i.e., rater x script and rater x script x criteria combined) on the six scripts with short sentences than there were on the scripts with long sentences. That means that raters tended to significantly score the scripts with short sentences either more leniently than expected (overestimations) or more severely than expected (underestimation) compared to the scripts with long sentences. The majority of bias terms in total (i.e., rater x script interactions and rater x script x criteria interactions combined) on both types of scripts were underestimations, i.e., significantly more severe than expected. However, on the rater x script interaction there were more overestimations on the scripts with long sentences (raters were significantly more lenient than expected).
There are a number of scripts that really stand out from table 5.27. From the scripts with short sentences, script 5 is, perhaps, the most notable. This script had a total of 25 underestimations but no overestimations. On the rater x script interaction eight raters underestimated this script (scored it more severely than expected). On the rater x script x criteria, this script was also underestimated on all four criteria, especially on Coherence and cohesion and Lexical resource. Similarly, script 11 was also markedly underestimated by the raters (13 underestimations in total compared to only two overestimations). It was overestimated by only one rater on the rater x script interaction and once on the criterion Coherence and cohesion in the rater x script x criteria interaction. Script 4 is another script with short sentences that is noteworthy. This script, contrary to script 5 and 11, had a total of 24 overestimations. Seven raters overestimated it on the rater x script interaction, whereas only one underestimated it. Further, the majority of overestimations on the rater x script x criteria interaction were on Grammatical range and accuracy and Coherence and cohesion (5 overestimations each).
As for the scripts with long sentences, script 21 was striking. It had the most underestimations (20 in total) of all the scripts with long sentences, and only one overestimation. Five raters underestimated the script on the rater x script interaction with only one overestimation. It was also underestimated on all the criteria on the rater x script x criteria interaction, though mainly on the criterion Lexical resource (five underestimations). Script 18 was also much underestimated by the raters (16 underestimations in total compared to 6 overestimations). However, what was interesting about this script was that an equal number of raters overestimated and underestimated it on the rater x script interaction (four each). Script 22 was also heavily underestimated (9 underestimations and no overestimation on the two interactions). Scripts 13 and 14, on the other hand were heavily overestimated by the raters. Script 13 was, in fact, the most overestimated script in the rater x script interaction (9 raters overestimated the script), and script 14 was the only script that was not underestimated in the aforementioned bias interaction.

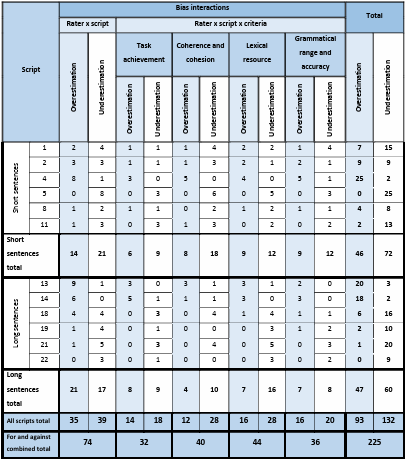
To make better sense of this, we need to consider the fact that we had two groups of raters in this study (NES and NNS), albeit with the NNS being more than double the NES (10 and 4 respectively). Thus, it would be beneficial to present each group’s bias terms separately as they have been shown to differ significantly in terms of their overall severity (see section 5.6) as well as their bias patterns (see section 5.7 and 5.9). The bias terms of the NES are presented in table 5.29 and those of the NNS in table 5.30.

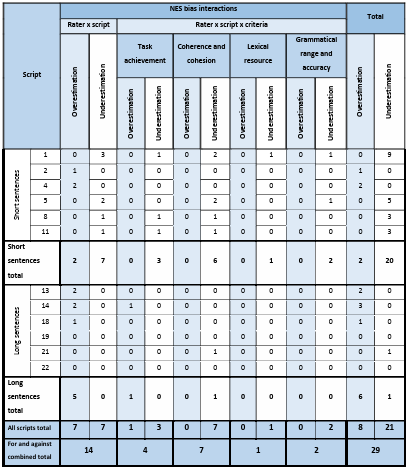
The four NES raters generally underestimated the scripts with short sentences (20 underestimations in total compared to two overestimations) and overestimated the scripts with long sentences (six overestimations compared to one underestimation). On the rater x script interaction, there were seven underestimations of scripts with short sentences with only two overestimations. Yet, on the scripts with long sentences there were five overestimations and no underestimations. Script 1 (short sentences) was the most underestimated script in total with nine underestimations and no overestimations in total (i.e., the total number of rater x script interactions plus rater x script x criteria interactions). This script was underestimated by nearly all the NES raters (three out of four) on the rater x script interaction. Script 5 was the second most underestimated script with five underestimations in total, two of which were on the rater x script interaction. Scripts 8 and 11 had identical bias terms on the rater x script interaction (one each) and on the rater x script x criteria interaction (one on Task achievement and one on Coherence and cohesion). Scripts 2 and 4 were the only scripts with short sentences that were overestimated, both of which had only one overestimation on the rater x script interaction.
The scripts with long sentences had far more overestimations (six in total). Script 14 had the most overestimations (three; two on the rater x script interaction and one on Task achievement on the rater x script x criterion interaction). Script 13 similarly had two overestimations, both on the rater x script interaction. None of the scripts with long sentences had underestimations except for script 21 on the rater x script x criteria interaction (on the criterion Coherence and cohesion). The ten NNS raters, on the other hand, had a much closer number of overestimations and underestimations on both types of scripts (scripts with short sentences and scripts with long sentences) (table 5.30). They generally had slightly fewer overestimations than underestimations on both types of scripts. The highest number of overestimations in total (i.e., rater x script interaction combined with rater x script x criteria) was found on script 4 (23 overestimations and only two underestimations). Scripts 13 and 14, as with the NES, also had a high number of overestimations compared to underestimations. Script 5, again similar to the NES raters, was the most underestimated script by the NNS raters with 20 underestimations in total. Another similarity to the NES was the high number of underestimations in total found on script 11 (10 underestimations in total, with only two overestimations). Whereas the NES underestimated script 1 the most (in total), the NNS had an equal number of overestimations and underestimations (seven each). Pertinent to scripts with long sentences, scripts 21 and 18 had the most underestimations, second only to script 5 (short sentences). Script 21 had a very high number of underestimations in the rater x script interaction. Half of the NNS raters (five) underestimated this script. Script 18 also had many underestimations on the rater x script interaction (four), but also several overestimations (three) meaning it was one of the more controversial scripts to score. The most overestimated script with the NNS raters on the rater x script interaction was script 13 (long sentences).
The bias terms, found in tables 5.29 and 5.30, were somewhat surprising, especially when compared to the bias interactions found in sections 5.7 and 5.9. In the previous sections, it was found that the NES raters tended to generally overestimate scripts with short sentences (by awarding more lenient scores than expected) and underestimate scripts with long sentences (by awarding more severe scores than expected), whereas the NNS did the opposite; they tended, in most cases, to underestimate the scripts with short sentences and overestimate scripts with long sentences. Here, the NES raters did the opposite; they overestimated the scripts with long sentences and underestimated the scripts with short sentences. The NNS, on the other hand, had more overestimations of scripts with short sentences than the previous NNS plus more underestimations of scripts with long sentences (see figure5.19).

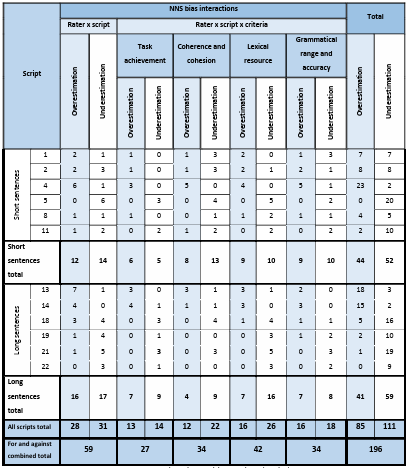
The cause of this change in bias interaction pattern is not clear. I hypothesise that it could be due to a number of factors. The first factor involves an element of chance. Even though the majority of the 30 NES raters in the quantitative part of the study overestimated scripts with short sentences, there were still a few rogue raters who behaved in a very NNS fashion (e.g., raters 61 and 21). Since there were so few NES raters in this part of the investigation (four), it could be the case that these four raters, by pure chance, behaved like the rogue ones in the qualitative part of the investigation.
One of the things that led me to this hypothesis is the fact that all the raters in this part of the investigation have lived in Kuwait for at least 10 years. Rater 71 (NES) moved to Kuwait at a very young age and mentioned in the interview that she has lived there for 40 years. Moreover, during the interview she also mentioned the fact that she tends to write using very long sentences (see subsequent sub-section for further details). Additionally, in an informal discussion after the interview, she informed me that she is married to a Kuwaiti, has bilingual children, she uses Arabic on a near daily basis, and upon listening to her speak in Arabic it was apparent she spoke the language fairly fluently. Kobayashi and Rinnert (1996) similarly found that NES teachers with more teaching experience in Japan were more appreciative of the scripts with Japanese rhetorical features than NES teachers with less experience. The second factor that may have contributed to the reversal in bias interaction patterns could be pertinent to the rating situation (context), in this case rating at home as opposed to school in the presence of a researcher. Eckes (2010) refers to such variables as “distal factors”, and these factors “may exert additional influence on the ratings, albeit usually in a more indirect, mediated or diffuse way” (p.32). It is argued that raters who rate with a group could yield more reliable ratings since rating standards are more likely to be enforced, and the sense of community amongst raters could be enhanced (Popham, 1990, cited in Myford and Wolfe, 2003; Weigle, 2002; White, 1994). When comparing trained raters who rate within a group to trained raters who rate scripts online, My ford and Wolfe (2003, p.6) argue that some raters “may find that they have difficulty functioning in a decentralized computer-based system, missing the camaraderie and the professional give-and-take they encounter in their interactions with other raters at their table”. Moreover, they argue that rating “alone in a location of their own choosing, raters may experience difficulty staying on task, and the online rating procedure may exact a toll in terms of their accuracy” (p.6). It is not unreasonable to assume that untrained raters may differ too in their rating behaviour from one setting to another.
The final factor that I believe could have very well led to this reversal in bias interaction patterns is what William Labov (1972) called the observer’s paradox (cited in Friedman, 2012, p.187). This paradox suggests that participants in any research will change their behaviour under the observation of a researcher, and this paradox could be related in some way to the previous ‘distal factor’ that was mentioned. It is obvious that rating scripts anonymously at home and placing them in an envelope prior to submitting them to the researcher is quite distinct from rating 12 scripts in one session in the presence of a researcher, who they know beforehand will interview them about their ratings. Even though the reversal of bias interaction patterns found in this part of the investigation could be a result of all three factors mentioned (and maybe other factors too), it is my personal belief that the observer’s paradox is the one factor that contributed most to this change in rating behaviour. I have no confident answer as to which of the two settings (rating at home or rating in the presence of a researcher at school) is most likely to reflect the actual rating behaviour of teachers, especially NNS who rate end-of-term high school writing tests! This section covered the motive behind conducting another set of interviews with 14 new raters, the 12 scripts used for the interviews, and the bias interactions found on each script before the interviews.
The next sub-section will shed more light on the bias interactions and what raters said about each script they overestimated (scored significantly higher than expected) or underestimated (scored significantly lower than expected). It will analyze the most striking bias interactions found in this section (tables 5.28, 5.29, and 5.30) and set out to establish why they were scored that way. Specifically, it will determine whether sentence length was a factor that contributed to these biases, or whether there were other factors that had a stronger, more direct influence. The first sub-section will explore the bias interactions of all the raters and classify raters into groups pertinent to what was said in the interviews regarding sentence length (section 5.11.1). I will then analyze the scripts that raters had noticed contained short/long sentences while they were scoring, and the bias interactions found in these scripts (section 5.11.2). Then the bias interactions of raters who expressed a general preference for either short or long sentences, along with their teaching instructions pertinent to sentence length (i.e., raters who explicitly instruct students to write using short sentences) will be covered in the sub-section after (5.11.3).
5.11.1 Rater biases and sentence length.
This, and the following sub-section will carefully analyze some of the biases (overestimations and underestimations) of the 14 raters involved in the second set of interviews and aim to ascertain why they overestimated (scored more leniently than expected) and/or underestimated (scored more severely than expected) certain scripts, and whether any of the biases were due to sentence length or other more salient factors. For reasons of space, only the most noteworthy scripts in terms of bias interactions that may be pertinent to sentence length will be discussed in great detail (see tables 5.28, 5.29 and 5.30). The emphasis will be placed mainly on scripts 14, 18 and 21 (all long sentences), and script 11 (short sentences) in this sub-section. That is because raters were aware of the length of the sentences in these scripts only. Then the bias patterns of raters who expressed a general preference for either short/long sentences, and whether they instructed students to write using short sentences, will be covered in the following sub-section, along with some other notable scripts.
It is useful to start by presenting a table that displays all the significant bias terms (t > +/- 2) associated with each rater. For reasons of space, this table will be presented in Appendix 42.
The table highlights each rater’s rater x script interaction, and his/her rater x script x criteria interaction. The overestimations (scored significantly more leniently) on both interactions (rater x script and rater x script x criteria) will be highlighted for the sake of clarity). I began by classifying the raters into categories pertinent to sentence length (table 5.33) based on what was said during the interviews. The first classification was in relation to raters’ expressions of a general preference for: (a) short sentences, (b) long sentences, or (c) other factors. Next, raters were classified according to the scripts they generally scored higher on average: (a) raters who awarded higher scores on scripts with long sentences (i.e., three or all of the criteria on the scripts with long sentences were scored higher on average), (b) raters who awarded higher scores on scripts with short sentences (i.e., three or all of the criteria on the scripts with short sentences were scored higher on average), and (c) raters who had a mixture (i.e., they gave a higher score for two criteria on one type of script but lower on the other two criteria, or had very similar scores on average). In addition, raters were also classified based on whether they instructed students to write using short sentences, and whether at any point in the interview raters were aware of the length of the sentences. The subsequent sub-section will explore the bias interactions of raters who noticed any of the scripts having short/long sentences when they were scoring, along with the overestimations and underestimations of the scripts that were identified. The first sub-section will analyze some of these classifications and the biases associated with each group in more detail.

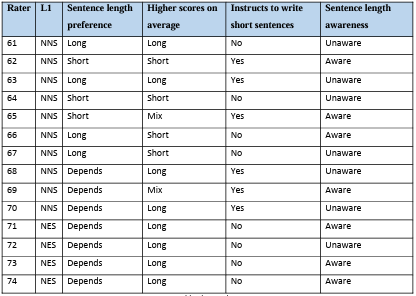
5.11.2 Rater biases and sentence length awareness.
The first point that is worth making is that nearly half of the 14 interview participants noticed that the length of some of the sentences in the scripts were either very long or very short (table 5.34). It is useful to explore the bias interactions of these raters and scripts to establish whether there are any clear patterns, along with the comments these (and other) raters made regarding the scripts. Three raters (65 NNS, 69 NNS, and 74 NES) noticed that some of the scripts contained long sentences. As an example, rater 65 NNS made a note ‘run-on sentences’ on three of the six scripts with long sentences (scripts 14, 18, and 21). She stated that she doesn’t like run-on sentences and that she usually instructs her students not to write overly long sentences. Moreover, this rater also stated that long sentences were ‘tiring for the eye’, ‘irritating’ and that she had trouble breathing while reading them. One of the main reasons that influenced her preference for short sentences, besides fewer ‘mistakes’, was her experience in writing classes at college. Her instructors, she stated, drilled her to write with short, simple sentences. One American professor in particular, she recounted, told her that he became ‘dizzy’ and ‘confused’ when reading long sentences. She added that:
“when you write a sentence, the reason there is a full stop is for the reader to stop, like think about the sentence they just read and then continue. But when I read a sentence that is too long, I usually- the ideas get like shattered. I don’t know what they’re talking about! And then I- like, I think about other things and while reading I don’t concentrate on the material… So, I don’t want to think about other things, I want to think about what you have written. So, give me a full stop, so that I can think about the sentence and then continue. The mind usually loses focus quickly… when reading a long sentence. This happens to me, I lose focus. Then I have to read it again, make my own full stops. I like to continue reading, not to read over and over again, and then lose focus… and… forget about things previously said.”
However, even though this rater (65 NNS) clearly expressed a general preference for short sentences, the difference in scores awarded to both types of scripts were negligible (a difference of .8 only between the average total of the four criteria combined (out of 36) in favour of the short sentences). Moreover, two of her significant overestimations were on scripts with short sentences (scripts 1 and 4) and one was on script 13 (long sentences). Her underestimations were also on a mixture of 3 scripts with short sentences (2, 8, and 11) and three scripts with long sentences (19, 21, and 22). In addition, there were 15 underestimations on the rater x script x criteria interaction; nine of which were for scripts with short sentences (scripts 2, 5, 8, 11). Thus, even though this rater personally preferred short sentences, generally instructed her students to write using short sentences, and noticed that three of the six scripts with long sentences had long, or run-on, sentences, there was no clear bias interaction between the rater and sentence length. When asked about the reason she awarded such a high score for script 13 (long sentences), which was the third highest score in total and one that was significantly overestimated with a t > 3.5, she argued that the “ideas were organized… [and because] the run-on sentence wasn’t the introduction. I didn’t lose focus… the organization is great”. In addition, she also stated that whereas some of the other scripts with long sentences had more than one idea in each sentence, this script (script 13) had only one idea in each sentence. So, it seems that in this case sentence length per se was not so much of a factor as organization, and that the real problem this rater had with some of the scripts with long sentences was the inclusion of more than one idea per sentence. Thus, loss of focus was her biggest issue with long sentences.

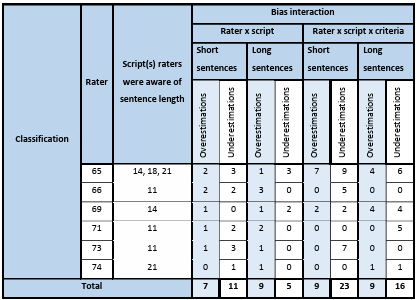
As with rater 65 (NNS), rater 69 (NNS) also made the point that script 14 contained some very long sentences, and reported that he too instructs his students to write using short sentences. Yet, in total, the average score of the scripts with short sentences and the scripts with long sentences was identical (16.6 out of 36). Furthermore, even though the length of the sentences in script 14 caught this rater’s attention, no significant rater x script bias term was found on this script. There was, however, a single significant rater x script x criteria found on this script for the criterion Coherence and cohesion (awarded a score of 3 out of 9). He defended this score by stating:
„Starting (the sentence) with ‘and’, as we teach our students it is not a good way to start with ‘and’. You have to use, for example, two sentences and put ‘and’ in the middle. Don’t start with ‘and’, it will be a weak form. We teach them like this. Something else here, long sentences, very long sentences- three-line sentence or four, look at this one for example, one, two, three, four, five lines. Five sentences… too long. It’s better to divide. We teach them like this. I am correcting as far as we use this way in our method of correcting in our school. This is a very long sentence, and it is not advisable to do it when writing, for them, for the students”.
However, rater 69 (NNS) did make positive comments about script 14, especially in relation to its vocabulary. In addition, this rater significantly overestimated script 13 (long sentences) both in the rater x script interaction as well as the rater x script x criteria interaction (on all four criteria). He did, nonetheless, significantly underestimate two scripts with long sentences (scripts 18, 19) on the rater x script interaction and the rater x script x criteria interaction (script 19 x Lexical resource, and script 21 x Coherence and cohesion and Grammatical range and accuracy). Yet, there were also underestimations of scripts with short sentences, namely script 5 and 11 (on the criterion Lexical resource). This, as was the case with rater 65 (NNS), made it hard to conclude that a clear interaction existed between the rater and sentence length. What could be deduced from this rater, based on his scores and comments, is that even though he generally preferred short sentences, and instructed his students to write using short sentences, he placed a lot of emphasis on vocabulary; he praised a script with long sentences (script 14) for its vocabulary, and underestimated two scripts with short sentences due to what he deemed ‘poor vocabulary’ (see scripts 11 and 5). This is an example of how the weight raters attach to certain criteria may influence the scores they award (Eckes, 2012; Knoch, 2009).
What was also interesting about script 14 (long sentences) was the fact that it was overestimated a lot by both groups of raters (NES and NNS). Nearly half the raters overestimated the script on the rater x criteria interaction, and it was the only script that was not underestimated by a single rater on the aforementioned bias interaction. Those who overestimated it on the rater x script interaction were raters 63, 64, 67, 68 (all NNS), 73, and 74 (both NNS). Moreover, along with script 4 (short sentences) it had the fewest underestimations on the rater x script x criteria interaction (two); rater 63 (NNS) on the criterion Task achievement, and rater 69 (NNS) on the criterion Coherence and cohesion. Both these raters happen to instruct their students to write using short sentences. However, raters 63 and 68 (both NNS) also instruct their students to write using short sentences, yet they overestimated the script on the aforementioned bias interaction.
The vocabulary of script 14 (long sentences) was one aspect that was most frequently praised by raters who overestimated the script. It was described as ‘distinguished’ (rater 63 NNS), ‘above average’ (rater 68 NNS), and ‘varied’ (rater 67 NNS). Particularly, lexical items like ‘profound’ (raters 63 and 68 NNS), ‘integral’ (rater 63 NNS) were praised. Further, both raters 68 (NNS) and 74 (NES) made a point that the script was very native-like. Rater 63 (NNS), similarly, thought the script had a “special fluency”. Moreover, the writer drew a brief comparison of life without internet to life without electricity, which raters 63 (NNS) and 64 (NNS) both liked.
One of the raters, 64 (NNS) who overestimated script 14 (long sentences), was one who had expressed a preference for short sentences, and, on average, scored the scripts with short sentences higher than those with long sentences. Despite this, she argued that she awarded this script a high score because the writer “expressed the idea in a good way… long sentences with good new vocabulary items, it will be fine. It will be excellent actually”. This rater also made a similar comment when asked about her overestimation of script 13 (long sentences). Thus, it cannot be said that sentence length per se influenced this rater’s scores.
An additional note worth making about script 14 (long sentences) is pertinent to rater 74 (NES) and the rating scale. This rater made a point that she believed that if she were to rate the scripts using another scale, then the rank order of some of the scripts would probably change. Nevertheless, script 14 (long sentences) would still rank the highest in her estimation.
Another script (18) that caught the attention of both rater 65 (NNS) and 69 (NNS) was written using very long sentences. When discussing this script, rater 65 noted “one, two, three, four and a half (lines)- too long. It’s better to divide. We teach them like this… This is a very long sentence and it’s not advisable to do it when writing, for them, for the students”. Yet these two raters did not exhibit a significant underestimation of this script in the rater x script interaction nor the rater x script x criteria interaction. However, this script was nonetheless problematic due to the high number of significant bias interactions (see tables 5.34 and 5.35, and Appendix 42). It was one of the rare cases were there were an equal number of significant overestimations and underestimations on the rater x script interaction (four each). The four raters who significantly overestimated the script were 62, 66, 70 (all NNS) and 72 (NES), whereas the four who underestimated it were raters 61, 63, 64, and 67 (all NNS).
The writer of this script wrote about a trip he/she would make to the United States during their one week without internet or technology, and went into detail about all the things s/he would do there, like a road trip from state to state, and visiting his/her favourite basketball team. What made this script even more interesting, and simultaneously problematic, was the contrasting nature of the comments raters made in relation to this script. For example, one of the main criticisms reported pertinent to script 18 was the lack of ideas. It was argued that this script consisted of only one main idea that went into great detail, when the task specifically stated that the writers should offer ‘some ideas’. This argument was articulated by raters 63, 64, 67 (all NNS who significantly underestimated the script), as well as a few other raters who had no significant bias terms pertinent to script 18 (raters 65, 69 NNS, and 72 NES). What was particularly surprising here was that one of the raters who significantly overestimated the script also criticized the script on similar grounds. Rater 66 (NNS) stated that the writer “didn’t really have a variety of ideas… I think he should vary the ideas… He keeps telling us about the road trip”. In contrast, rater 73 (NES), who also scored the script rather favourably, but did not significantly overestimate it, stated that: “it’s fairly well structured, and it has a range of ideas of how he could spend his time… he elaborated on different places that he would visit and had lots of ideas”. Similarly, rater 72 (NES) stated that there were “a couple of ideas” which were praiseworthy. In addition, rater 69 (NNS) also criticized the fact that the writer mentioned only one idea, and would have liked it if he/she would have tackled at least two ideas, but felt that the one idea mentioned was well developed and very organized.
Another contrast in the comments on script 18 (long sentences) was pertinent to relevance. Raters 61, 63 and 64 felt as though the script (script 18) contained “too much irrelevant detail” and that the idea of visiting the United States was “unrelated to the task” (raters 61 and 64 respectively). Additionally, rater 67 (NNS) made the following point:
“First of all, it was not answering what you gave them, what you asked them to do. It was just talking about their own trip and what they do in their life and how they live their life. Like, ‘I want to travel there, I want to have fun here’, as if there are no other activities to do or no other good things that person can do in her or his life, other than travel to America and going to a basketball team in Chicago”.
On the other hand, rater 73 (NES) argued that it was:
“logical and relevant as well. So, she’s thinking how she’s going, where she’s going to stay, how she’s going to get from place to place. Shows her knowledge of the different places that she’s going to visit. It’s quite- she mentions Miami, California, West Coast, Los Angeles, Washington. So quite a few places that she’d like to visit. Then she goes on to more ideas, ‘Take a different road back to New York to see other places, Like Chicago’. Also, personalizes it as well. You know their favourite basketball team… So, that’s pretty well structured to me. Then in conclusion, she sums it up well”.
There was also a contrast in the comments made by some of the raters regarding the grammar and comprehensibility of the script. Rater 67 did not like the grammar, and felt that the script lacked punctuation (namely, exclamation and question marks). Additionally, rater 64 complained that she could not understand what the writer was trying to say. Conversely, rater 70 (NNS) praised the coherence and cohesion of the script and the fact that it contained much’ fewer grammatical mistakes’ compared to all the other scripts. Furthermore, rater 71 (NES) praised the fact that the script was “set out properly. It had an introduction and conclusion… it was easy to read. It was straightforward. It made sense”.
An additional aspect that was criticized by two raters who underestimated script 18 (long sentences) was pertinent to the plausibility of some of the content. Rater 67 (NNS) objected to the fact that this writer would use a car to go on his/her road trip, on the grounds that a car is a part of technology. Thus, he felt this idea violated the task. Similarly, rater 61 (NNS) argued that to go on this road trip, the rater would need a Global Positioning System (GPS). And this, according to him, is classified as a ‘computer’, resulting in a violation of the task.
Referring back to raters who noticed that the scripts had long/short sentences, the final rater who noticed that a script had overly long sentences was rater 74 (NES). This rater, who did not have a personal preference for short or long sentences, and generally scored scripts with long sentences more favourably (Long sentence total average= 23 (out of 36); short sentence average= 21.3), nevertheless criticized the length of sentences in script 21 and felt that the writer was “just ranting in their head and copying it down onto paper without thinking ‘Okay, how would I break this up? What would be good English?’… Yes, they’re just ranting to fill up space, rather than having a plan”. However, when analyzing what this rater previously said about script 21 (long sentences), which was awarded the joint lowest total score on average (19 out of 36), it became apparent that the content itself was somewhat problematic to the rater as well. The writer here spoke about how s/he would spend all his/her time undertaking an Islamic pilgrimage (Umrah), and focused a lot on Islam and religion. The writer suggested that non-Muslims should also experience this Islamic pilgrimage. This script, along with script 5 (short sentences) was awarded the lowest scores on average (see Appendix 42). Regarding the writer’s suggestion of non-Muslims going on the Umrah, rater 74 (NES) questioned the plausibility of the suggestion and said:
“I’m thinking, ‘Can a Christian go to Umrah?’ I know they can’t go to Hajj, and I’m thinking, ‘I don’t really know if they can actually participate’. If they can’t participate then that’s not true, what’s been written there. It’s not actually the task of the question, because I know I’m not allowed at Hajj, I don’t know if I’m not allowed at Umrah. I’m Christian, so therefore, how would that activity relate to me? It couldn’t. I couldn’t do that activity and that suggestion in there. And also, his sentence structure is a bit ‘Hmm’, and the grammar. It impacted on the reading of the-generally, with all the rubrics, you’ll find that if your comprehension and your reading is impacted upon, and the greater its impacted upon, the lower the marks that go down, because the communication is affected, obviously by grammar, by spelling, by syntax”.
It is worth noting that the majority of raters criticized the content of this script too. They felt that bringing religion into the script was ‘needless’ (rater 62), ‘repetitive’ (rater 64, 68 and 69), and even ‘racist’ (rater 65 and 67). Rather 70 (NNS) made a similar point to rater 74 (NES) about the plausibility of a non-Muslim going for the Umrah. He also criticized the “excessive use of the subjective ‘I’ and argued that this “is not good”. He, similar to rater 74 (NES), felt that the writer appeared to be ‘rambling’. He, however, did not underestimate (or overestimate) the script. Furthermore, rater 65 (NNS) stated: “I hate this one… I think the ideas were, yes they were racist… I don’t like discriminating between religions”. She also felt that it was ‘inappropriate’, and that if a non-Muslim read it they would be ‘furious’. Additionally, along with repetition and lack of relevance, rater 69 (NNS) criticized the organization, paragraphing and arrangement of ideas.
Conversely, two NES raters (72 and 73), who awarded script 21 (long sentences) a rather higher score than the rest of the raters, were not at all bothered by the religious nature of the content of the script. Rater 72, for instance, argued that:
“You’re entitled to write what you like. I don’t think he should be put down for it… He was asked for his ideas, so these are his ideas… They’re quite entitled to write what they like, what they think appropriate… You shouldn’t have to bring religion into an essay, but then it’s his opinion… Why should you mark somebody down for giving their opinion of who they are? I don’t think I would”.
Furthermore, rater 73 said of script 21 (long sentences):
“Obviously, there are some mistakes in it, of the grammar of how they are answering the question, but the ideas are pretty well structured. And you know it’s a logical answer. So, this is what they’re saying that will help answer the question. They offer the suggestion that you can go to the Umrah for a week and they think that you can go there. Then if you’re not a Muslim as well, you can do other things. Obviously, they’re just making suggestions. It’s good. She’s made consideration for people that are Muslim and non-Muslim as well… So she’s shown a good command of English and tried to answer the question logically”.
She also added that she thought that the writer was trying to play it safe and incorporate language that s/he already knows, which she argued was just fine. These two NES raters (72 and 73), nonetheless, did not overestimate (or underestimate) script 21 (long sentences).
What I found interesting regarding raters who were aware of sentence length was that those who noticed long sentences did so only on three of the six scripts (scripts 14, 18, and 21). However, what I found even more interesting was the fact that those who noticed short sentences did so only on script 11. Raters 66 (NNS), 71 and 73 (both NES) all made comments about the sentences in script 11 being too short. For example, rater 71 (NES) stated that the sentences were “too short”, and rater 73 NES mentioned that they were “short” and “abrupt”. Rater 66 was the only rater of these three who expressed a preference for long sentences, even though she awarded higher scores on average to the scripts with short sentences. Moreover, even though she noticed the short sentences in script 11 she awarded it a fairly high score (the fourth highest score in fact). However, no bias terms (overestimations or underestimations) were found on any of the two bias interactions. Much like scripts 18 and 21 (long sentences), which were previously discussed, this script too was somewhat problematic. There were a total of 10 underestimations of the script by NNS raters and a total of 2 overestimations. With the NES, however, there were three underestimations in total and no overestimations on either of the two bias interactions (rater x script or rater x script x criteria) (see tables 5.28, 5.29 and 5.30).
Of the three raters who noticed the short sentences in script 11, rater 73 (NES) was the only one who underestimated the script on both bias interactions. She stated that the writer:
“incorporated language that she obviously knows- or is it a he, but it’s too abrupt and incoherent… It’s just unrelated sentences all put together… there’s a lot of isolated sentences. So, it’s not really formed together well… It just makes reading difficult”.
Similarly, rater 66 (NNS) also felt that the script contained a lot of short sentences that could have been linked together to form more complex sentences. She gave an example where the writer was writing about his Jiu Jitsu coach in two sentences that could have been conjoined: “He is very good and has many skills. I wish to be like him”. In addition, rater 71 (NES), who also noticed the script contained many short sentences, stated that she would have preferred it if s/he had attempted to write more complex sentences, even if the writer had made more mistakes. “It’s not that they’re short” she argued, “he’s just not trying hard enough”.
Another impression raters got from the script, particularly those who underestimated (raters 69 (NNS) and 73 (NES)), was that the writer was simply filling up space to satisfy the task word limit requirement (200 words). Rater 69 (NNS) believed that many of the ideas stated in the script were irrelevant, and speculated whether “it’s put just to complete the number. It’s needed to write 200 words, okay, I’ll write some extra information”. Likewise, rater 73 (NES) stated that “it just seems like she’s adding one idea on top of the other just to fill up the space”. It is noteworthy that both these raters felt this way particularly when the writer spoke about his coach, which rater 66 (NNS) felt could have been expressed in a more complex sentence. Rater 71 (NES) also felt that mentioning the coach was irrelevant. Other parts of the script were also criticized for being irrelevant by raters 65 (NNS), 69 (NNS), both of whom underestimated the script, 68 (NNS), and 71 (NES).
One unique criticism of this script (11 short sentences) was the seeming drop in proficiency level as the script progressed. Rater 71 (NES) praised the opening sentence of the first paragraph by stating: “As a first sentence, that’s wow. Okay. That’s good English, coherent”. Then when discussing the second paragraph she stated: “Considering his first paragraph, maybe he got tired on the second… it was a good paragraph, but then it fizzled out”. A similar observation was made by rater 68 (NNS), who felt that the script started off well, but “then I found out that it didn’t match my expectation”. Rater 66 (NNS) and 74 (NES) were also impressed with the topic sentence and introduction, as well as the overall organization. Furthermore, when rater 62 was questioned about this script, he re-read some of it and seemed unsure of having given the score I quoted. It could be inferred that upon re reading the script during the interview, he noticed the shift in proficiency level and felt that the script deserved a different score. However, when asked if he wanted to change the score he declined.
It is worth noting that the first paragraph of the script covered various sports and activities that the writer would do (getting fit, playing football, practicing Jiu Jitsu, going to the gym), whereas the second mentioned visiting family and friends. Judging by the comments made on other scripts that were overestimated or underestimated, I believe that the general content and ideas presented had heavily influenced the scores. Raters on every script that was either overestimated or underestimated mentioned something about the content and ideas (amount of detail, variety, clarity, appropriateness, relevance, etc.) as a reason as to why they scored in a bias manner. The majority of these comments were based purely on their perceptions of the ideas presented (see section 5.11.4). Thus, it could be argued that the content of the second paragraph was not as interesting as that of the first.
This change in proficiency level throughout a script can also be related to one of the most frequently cited problems that raters encounter when using the rating scale; numerous levels in the script. This was one problem faced by raters 64, 66, 67, 68 and 79 (all NNS) when using the rating scale to score the scripts. Rater 69 (NNS) mentioned that:
“some essays when I read them I get confused a little. Shall I score three or four? There are some parts from three, some parts from four… some parts which apply here, for example, to number four and some things number three. I have to choose one”.
Moreover, the only other script where raters faced this problem, besides script 11, was script 1 (short sentences). Rater 67 (NNS) reported that he was torn between two scores because of:
“the style of writing. As I said before, it just goes and then when you read through it, it just goes lower and lower. That’s why I was like: ‘I don’t know what to give them… the first part was great, and as it goes down halfway through it was just like shifted”.
Similarly, rater 64 (NNS) expressed the confusion she felt when deciding on a score for script 1:
“This person begins her writing in a good way… At the beginning, it was good, then at the end she wrote something else. I couldn’t make it out… It was clear at the beginning, then it wasn’t clear at all”
It is not uncommon for even trained raters to face problems when rating scripts that exhibit features from more than one band on the rating scale, especially when using holistic scales (see Barkaoui, 2010; Knoch, 2009; Lumley, 2002 and 2005). However, this is my first encounter with raters who, figuratively, split the script in half and believe that the first half deserves a score higher than the second. I maintain that this could be due to the content of the two halves, rather than an actual drop in proficiency level. This problem, nonetheless, needs to be addressed in any future rater training and/or teacher certification in Kuwait.
Other aspects of script 11 (short sentences) that were criticized by the raters and cited as reasons for their underestimations, or lower scores, included: (a) the repetition of ideas/vocabulary (raters 61 (NNS) and 72 (NES)), (b) grammatical mistakes (raters 65 (NNS), and 73 (NES), who both underestimated the script, and 62 (NNS), who overestimated the script, as well as 61, 66, 70 (all NNS), and 74 (NES)), (c) and punctuation (rater 61 and 70 (both NNS)).
Thus far, all the scripts that raters detected as having either long or short sentences have been discussed in great detail in terms of their bias interactions and comments made by the raters. There were no bias interactions (rater x script) between any of the three raters who noticed the scripts with long sentences and the scores they awarded them. Of the three raters who noticed that script 11 contained short sentences, only one rater (73 NES) underestimated it on the rater x script interaction. She, however, argued that her underestimation was due mainly to weak sentence formation, an impression that the writer was filling up space to satisfy the word requirement, and irrelevant information. As a result, it is safe to assume that awareness of sentence length when rating scripts had no influence on the scores. This conclusion is based the bias interactions of these six raters and the comments they (and others) made on the four scripts.
The next sub-section will explore rater biases in relation to their preferred type of sentence (short or long), as expressed in the interviews, along with those raters who stated that they explicitly instruct students to write using short sentences (or avoid writing long sentences).
5.11.3 Rater biases and sentence length preference, and teaching instruction.
To further investigate the influence sentence length had on raters, it is worth summarizing the bias interactions (overestimations and underestimations) of a few selected raters based on their classifications in table 5.33 (section 5.11.1). This will highlight other scripts worth discussing in more detail pertinent to sentence length. These classifications are pertinent to sentence length. Specifically, I will analyze the bias interactions of raters who: (a) expressed a preference for short sentences, (b) expressed a preference for long sentences, and (c) raters who explicitly stated that they instruct their students to write short sentences. A summary of their overestimations and underestimations on the rater x script and rater x script x criteria interactions is presented in table 5.35.

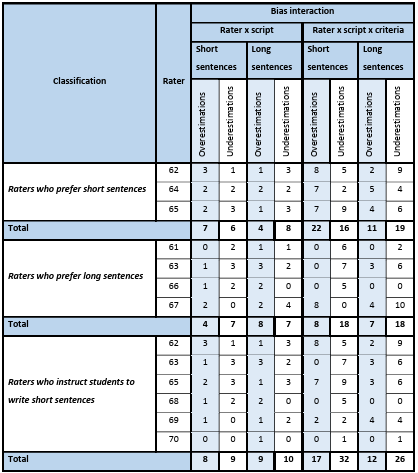
The first classification in table 5.35 is of raters who expressed a general preference for short sentences. These raters generally did overestimate the scripts with short sentences more than those with long sentences. On the rater x script interaction, they overestimated seven scripts with short sentences and four scripts with long sentences, and underestimated the scripts with short sentences a total of six times, whereas they underestimated the scripts with long sentences eight times. On the rater x script x criteria interaction, they had a total of 22 overestimations for scripts with short sentences, and 11 overestimations of scripts with long sentences (double). Furthermore, also on the rater x script interaction, the number of underestimations for scripts with long sentences was slightly higher in total for the scripts with long sentences (19 vs 16).
The most common reason cited for these raters’ general preference for short sentences was a reduction in the number of ‘mistakes’. Rater 62 stated that:
“when students write long sentences, I think they are about to make mistakes. So, we prefer students to write in short sentences… I actually advise them (to write short sentences), to get higher marks, because when you write short sentences, I think you are not going to make mistakes”.
The view of rater 65 (NNS) on sentence length, and her preference for short sentences, has already been discussed in great detail (see section 5.11.2). Rater 64 (NNS) also expressed her liking for short sentences. This proved rather problematic as at first she expressed a strong preference for short, simple sentences. She argued that short sentences, when clear, were ‘direct’, ‘easy’, ‘more relaxing’, and gave the reader ‘peace of mind’. She also related this preference to her own disposition and desire for simplicity in life in general. However, after
a few probing questions, she then stated that she had no preference and that she liked both short and long sentences. She made the point that she will give a good mark to what ‘appeals’ to her, regardless of sentence length. The scores she awarded show that, on average, the scripts with short sentences were higher on all the criteria except Grammatical range and accuracy. Her bias on the rater x script interaction shows an identical number of overestimations for scripts with short sentences and those with long sentences (two apiece), and an identical number of underestimations (again two apiece). On the rater x script x criteria, there were slightly more overestimations for scripts with short sentences compared to scripts with long sentences (seven and five respectively), and fewer underestimations for scripts with short sentences than long (two and four respectively).
A strong case could be argued to include this rater in the group that expressed no preference pertaining to sentence length (see below). Yet, my decision to include her in this group was based on the following: (a) my instinct as a researcher that she did indeed prefer short sentences, but felt awkward after being questioned. The adoption of a more neutral stance followed when she could not defend her original choice, and (b) the slightly higher number of overestimations of scripts with short sentences on the rater x script x criteria interaction, as well as the fewer number of underestimations on scripts with short sentences on the aforementioned bias interaction. I later contacted this rater’s head of department to invite her to participate in a follow-up interview, but she declined owing to other commitments.
Even though there were more overestimations of scripts with short sentences than scripts with long sentences in total, especially on the rater x script x criteria interaction (table 5.35), there were, nonetheless, too many overestimations of scripts with long sentences and underestimations of scripts with short sentences, to draw any conclusions or establish a clear bias for scripts with short sentences.
The one script that the three raters did overestimate was script 4 (short sentences). This script was the most overestimated script, with a total of 25 overestimations on both bias interactions combined (table 5.27). The script also had the fewest joint underestimations in total (two). Additionally, it was also the second most overestimated script on the rater x script interaction (eight) and the second least underestimated (one). What is even more interesting is the fact that two of the four raters, who expressed a preference for long sentences, also overestimated the script (raters 66 and 67 NNS), as well as one of the raters who instructed their students to write short sentences (rater 69 NNS).
One unique aspect of this script was the long introduction where s/he drew comparisons between the past and present. This accounted for nearly half the script (two of the four paragraphs) and was arguably the most controversial aspect. It was conversely praised and criticized by some raters who overestimated the script and cited by one as a reason for his underestimation. The majority of raters who overestimated the script did, however, appreciate the past-present comparison (raters 64, 65, 66, and 67, all NNS). As an example, Rater 65 (NNS), stated:
“I loved how they used a different introduction than the others… Because when I recall how the past was, I would be like ‘Oh, I know how to spend my life… So, it really went to the point… a great introduction”.
Correspondingly, rater 65 (NNS) praised how the writer “paved the way” with this comparison. However, other raters who also overestimated the script felt that this past-present comparison was irrelevant. Rater 73 (NES) felt that the writer was giving general information and “talking about the technology, and how it affects life rather than how it would affect her personally”. Likewise, rater 69 (NNS) also stated that this was irrelevant and it was the only part that he did not like about the script. Rater 63 (NNS), who was the only rater to underestimate script 4 (short sentences) also criticized this past-present comparison, and felt that it was irrelevant. He argued that only after the halfway mark on the script does the writer mention any ideas pertinent to the task, and even then, the ideas were too limited and lacking in detail.
One feature that was liked by virtually all the raters who overestimated script 4 (short sentences) was the clear paragraphing. Nearly all stated that they appreciated how the script had a clear introduction, body and conclusion (raters 62, 64, 65, 66, 69 (all NNS), and 71 (NES)). Another key feature admired by many of the raters who overestimated script 4 (short sentences) was its vocabulary. Rater 65 (NNS), for example stated that the script contained “excellent lexical items”. These raters highlighted words such as ‘essential’ (raters 65 and 66), ‘possibility’ (raters 65 and 66), ‘moreover’ (raters 64 and 69), ‘expanding’ (rater 66), ‘rhythm’ (rater 64), ‘extremely’ (rater 64), and ‘nowadays’ (rater 69). Script 14 (long sentences), which was similarly overestimated by the majority of raters on the rater x script interaction, was also appreciated for its vocabulary (see subsequent section for further detail).
To establish whether sentence length was a factor that influenced the raters’ scores, it is worth shedding light on some of the individuals shown in table 5.35. Rater 62(NES) stands out as being one influenced by sentence length. This is because he expressed a general preference for short sentences, instructed his students to avoid writing long sentences, and generally overestimated scripts with short sentences (three scripts as opposed to one script with long sentences), and underestimated scripts with long sentences (3 scripts, whereas he only underestimated one script with long sentences). What is more interesting is the fact that this was the only rater who overestimated script 11 (short sentences), and the only rater who underestimated script 13 (long sentences) on the rater x script interaction. In fact, all the overestimations for script 11 (short sentences), and all the underestimations for script 13 (long sentences) on both rater x script interaction and rater x script x criteria interaction were by this rater.
With a Fit MnSq of 3.15 (see table 5.7), which is substantially above the acceptable parameter of .5 1.5, this rater proved very unpredictable in his ratings. It was unfortunate that this rater asked me to cut the interview short because of tiredness which resulted in a less that detailed explanation of his biases. However, judging from the scripts that he did discuss in detail, his comments focused on the nature of ideas. For instance, his underestimation of script 21 (long sentences) and 13 (long sentences) was chiefly due to the religious content (Muslims and non-Muslims), and the limited amount of activities mentioned respectively. Moreover, as touched on in the previous sub-section, this rater underestimated script 13 because of an idea which he felt was not plausible. The writer suggested he would study a new language in the week without internet, which rater 62 (NES) felt was too difficult. He also stated that the writer “didn’t give me the idea I am looking for”. Even though this rater briefly criticized the grammar of some scripts (script 13 (long sentences)), it was apparent that the bulk of his criticism was pertinent to the ideas expressed. Hence, it appears that sentence length had little to do with his bias interactions.
The second classification of raters shown in table 5.35, are those who expressed a general preference for long sentences. Overall, there were no clear bias patterns in this group. There were a total of eight overestimations of scripts with long sentences on the rater x script interaction, and four overestimations of scripts with short sentences. Script 4 was the most frequently overestimated script with short sentences within this group (twice), whereas scripts 13 and 14 were the most overestimated with long sentences (three of the four raters overestimated script 13, and two overestimated script 14). Scripts 4 (short sentences) and 14 (long sentences) were discussed in greater detail in the previous sub-section. With reference to script 13 (long sentences), some clarification is needed as to why it was overestimated by three raters who had expressed a general
preference for long sentences, in addition to six others who also gave overestimations.
Similar to script 14 (long sentences), this script was highly praised for its organization, paragraphing and clear introduction, body and conclusion (raters 63, 66, 68 and 69 (all NNS), raters 71 and 72 (both NES)). The variety and quality of ideas were also cited a good deal. Rater 68 (NNS) described the ideas as “rich” and well connected. Rater 63 (NNS), stated that the script contained some “interesting facts or ideas”. He went on to state, compared to other scripts, “there are more ideas, more choices. There are many activities… it is full of activities”. Interestingly, raters 64, 66, 67 (all NNS), and to a lesser extent 71 and 72 (both NES), criticized the script for having grammatical, spelling and punctuation mistakes. This was in spite of the fact that they had overestimated the script. Interestingly, rater 62 (NNS), who, as previously discussed, was the only rater to underestimate script 13 (long sentences), argued that the script contained too many details, no variety of activities and felt that there were many grammatical mistakes.
The final classification of raters in table 5.35 is pertinent to their teaching instructions. Namely, raters who stated that they explicitly instruct their students to write using short sentences (or advise them to avoid writing long sentences). Over half the NNS raters mentioned that they instruct their students in the aforementioned manner, yet none of the NES did so. What is notable about this group of raters is that it includes rater 63 (NNS), who stated that he preferred long sentences. He argued, however, that his preference for long sentences is in his own writing but he advises his students against it. Interestingly, he did state that if a student writes an error-free, long sentence then he considers them to be ‘talented’. Moreover, this list of raters also includes three who had no preference for short/long sentences, yet still instructed their students to use short sentences to avoid ‘mistakes’.
Concerning this group’s bias patterns, it is apparent that no script type (short or long sentences) is substantially overestimated or underestimated. On the rater x script interaction, there were eight overestimations of scripts with short sentences and nine on the scripts with long sentences. Furthermore, there were nine underestimations of scripts with short sentences and ten on scripts with long sentences. Other than rater 63(NNS) who was discussed previously, none of the raters showed a remarkable interaction pattern.
It was apparent, from the bias interactions shown both in this section and the preceding one that the actual ideas presented in the scripts had a massive bearing on the scores that were awarded (overestimations and underestimations). Comments that were made on virtually every script (that was either overestimated or underestimated) related to either the quality, variety, arrangement or the details of those ideas. This, I believe, is a direct result of the scoring procedures used in Kuwait’s high schools, especially for NNS. Teachers are required to rate scripts out of a total of ten or twelve. The criteria that carries the most weight on the scoring rubric (see Appendix 43) is ‘Exposition of ideas, paragraphing and number of sentences’ (five out of 10 for grade 10, and seven out of 12 for grades 11 and 12). McNamara (1996) believes that when raters are given a new rating scale, they are highly likely to revert to either a familiar scale or one with which they feel is more comfortable.
Admittedly, this could be a factor here as, owing to practical reasons, the scale used in this study may not have adequately mirrored the construct of the writing task (see section 4.4.3). Nonetheless, the scoring rubric (scale) of the Ministry of Education-Kuwait is extremely problematic. The term ‘Exposition of ideas’ is especially vague. The term lends itself to subjectivity, hence much construct irrelevant variance. The diverse nature of comments pertaining to ideas is, perhaps, a testament to this. As noted in the discussion of the bias interactions of script 18 (long sentences), the problem relates to the perceived superiority of either one main idea that is expanded and detailed over that of multiple ideas that are mentioned only briefly. Of the eight raters who had a bias interaction on that script, the four who overestimated support the former notion whereas the four who underestimated it would argue for the latter. Even if a rater were to decide on the latter (variety of ideas), measuring ‘variety’ is also problematic, as evidenced in script 13 (long sentences). While the majority of raters who overestimated the script praised its variety of ideas, rater 62 (NNS) underestimated the script and criticized it for lack of variety.
The relevance of ideas was another area where the raters were at variance. On script 4 (short sentences) some of those who overestimated the script liked the fact that the script had a two paragraph introduction, felt that it was relevant to the task and that it “paved the way” (rater 64 NNS) for the main ideas. In addition, they liked its past-present comparison. Conversely, other raters who also overestimated the script were critical of this comparison and felt that it was irrelevant. Of greater interest is the rater who underestimated the script, citing the long introduction and past present comparison as a reason. In summary, some raters felt it was relevant and overestimated the script, others felt it was irrelevant despite overestimating the script and yet another felt it was irrelevant and underestimated the script.
The aforementioned problems were also apparent in the bias interactions of script 21 (long sentences). The majority of raters did not like the religious content of the script, felt it was irrelevant and ‘racist’ (raters 65 and 67 both NNS). Rater 65 (NNS) went so far as to assert that she hated the script. On the other hand, two NES raters (72 and 73) were unperturbed by the ideas and content. Rater 73 said that the writer “was asked for his ideas, so these are his ideas”. This is a lot more in line with good writing assessment practice (Crusan, 2010; Weigle, 2002).
It has often been found in the literature that raters may award very similar scores for completely different reasons (Connor-Linton, 1995; Lee, 2009; Shi, 2000), yet the examples of script 21 (long sentences) and script 13 (long sentences) was an intriguing paradox. Raters criticized (or praised) the same aspect of a script, yet awarded substantially different scores. Script 21 (long sentences) was the subject of many bias interactions (table 5.27). It was involved in 21 significant bias terms, only one of which was an overestimation (NNS 61). It was significantly underestimated by half of the raters on either the rater x script interaction or the rater x script x criteria interaction. Even though the majority of the raters shared similar criticism of the religious content of script 21 (long sentences), their scores ranged from two to seven on all four criteria. Furthermore, as mentioned in previous sections (5.7 and 5.9), the proposal to pair raters and average their scores to arrive at a more valid final score is not always fruitful. By way of illustration, raters 61 and 66 (both NNS) along with 71 (NES) all awarded a score of seven on Task achievement. The pairing of either of these raters would result in a highly reliable, yet significant overestimation of the writer’s ability.
The outcome remains unchanged if raters 72 and 73 (both NES) are paired. The pairing of NES and NNS would also produce the same result. If either one of raters 61 and 66 (NNS) was paired with NES 71, 72 or 73, the writer’s writing ability would still be significantly overestimated, even though the score awarded would be deemed statistically reliable. Likewise, the pairing of the two raters who were very critical of the religious content of the script, rater 70 (NNS) and rater 74 (NES) would result in a significant overestimation of the writer’s ability. Rater 70 awarded a score of five and rater 74 awarded a score of six. Thus, combining their scores would result in five and a half out of nine. On the other hand, the pairing of raters 62 and 67 (both NNS) who also criticized the content of script 21 (long sentences), and who both awarded the script a score of two on Task achievement, would again be problematic. The writer’s score would be significantly underestimated, though statistically highly reliable. In either case, such construct-irrelevant variance cannot be ignored.
Another problem, namely that of plausibility of some ideas, became apparent from the interview data. A number of raters underestimated scripts for containing ideas that they felt were either implausible/illogical or contradictory. On script 18 (long sentences) two NNS raters (61 and 67) questioned some of the content’s plausibility. Rater 61 argued that it was evident from the script that this writer had never been to America, and thus, if he/she were to rent a car, they would need a Global Positioning System (GPS). Because this piece of equipment is classified as a computer, he maintained that it violates the requirements of the task. I asked whether he felt that it was reasonable to deduct marks for stating an idea which he felt was neither plausible nor practical and he replied that it was. Rater 67 made a similar argument that a car is part of technology. Other raters also significantly underestimated some scripts for ideas which they felt were not plausible, practical or logical. Rater 62 (NNS) significantly underestimated script 13 in the rater x script interaction, and also significantly underestimated Coherence and cohesion and Lexical resource on that script.
He argued that the writer stated that s/he wanted to learn a new language in his/her one week without technology, and that this was too difficult. Similarly, script 2 was significantly underestimated by rater 65 (NNS) in the rater x script interaction and the rater x script x criteria interaction on the criterion Lexical resource and Grammatical range and accuracy due to its contradictory nature. The rater argued that “this one was at first ‘it’s horrible’, but then ‘I can do it’, but then ‘it’s hard’, but then ‘I can do it’… So, it was like opposing oneself, it was opposing him or herself”. A very similar argument was made by rater 73 (NES) on script 1, which she significantly underestimated in the rater x script interaction. She stated that “it’s a bit contradictory. ‘I do think it would be quite an eye opening experience and maybe quite refreshing’, then ‘I’m not sure I can do it though’”. Raters 70 (NNS) and 74 (NES) also significantly underestimated script 21 due to an idea that they felt was implausible; the writer suggested that non-Muslims should experience an Islamic pilgrimage (Umrah), which, according to the raters, is not permissible for non-Muslims.
A finding like this should cause alarm in language testers in general, and educators in Kuwait in particular. Writing is an extremely complex process, and penalizing writers (students) for an idea or statement that may not be plausible/practical/logical in their own minds goes against basic standards of writing assessment (Crusan, 2010; Weigle, 2002). The implication being that, in addition to their language ability being put to the test, their general ability to reason was also being assessed, resulting in some construct-irrelevant variance. What I found even more worrying was that not all the examples cited by the raters were indeed implausible or illogical (contradictory). A GPS may well be regarded as a type of computer, but it is not the stereotypical image that springs to mind when one hears the term ‘computer’. Moreover, the idea of a road trip could well be undertaken using a map. Learning a new language in one week is indeed ‘hard’, as stated by rater 62 (NNS), but the writer explicitly stated that s/he would “start learning a new language”, and did not seem to suggest s/he would learn it proficiently in that one week. Even if this was not explicitly stated, or the rater overlooked this statement, it would be reasonable to assume the writer’s intention was to start learning. Furthermore, raters’ comments on some statements being contradictory were also problematic. In script 2, the writer stated that one week without the internet and technology would be ‘horrible’, which is not incompatible with his/her expression of confidence in managing this one week. Likewise, the writer of script 1 described this one week as an “eye-opening experience”, and this does not contradict his/her personal concern about whether s/he could cope.
It has been demonstrated that novice raters were more personally engaged in the scripts they were rating (Hout, 1993; Wolfe, 1997; Wolfe et al., 1998). Vaughan (1991) found that even trained and experienced raters sometimes based their ratings on features that were unrelated to the holistic rating scale they used. Barkaoui (2010) argues that the use of an analytic scale will limit this such cases by focusing the raters’ attention, especially novice ones, on the criteria separately. Yet, even though an analytic rating scale was used here, raters still relied upon criteria that was unassociated with the rating scale. I would argue that the only way this could be resolved is through proper rater training.
Eckes (2012), using data from his 2008 investigation, found that there was a significant bias interaction between criteria that raters perceive as more important and their scoring of those criteria. In addition, Lumley (2002, 2005) also found that there was some conflict between raters’ initial intuitive impressions of the quality of written texts and the descriptors of the rating scale which resulted in the adoption of other criteria to arrive at a rating. This was also mirrored by the findings of Sakyi (2000), Smith (2000, cited in Barkaoui (2010)), and Vaughan (1991). It appears that raters may have in their heads a number of criteria they feel are important that are not explicitly stated on the rating scale, like imagination and creativity. And when a script cannot be matched to a descriptor on the rating scale, raters are likely to resort to unstated criteria. Moreover, it is worth asking the following question: if raters can sometimes exhibit a halo effect where the score of one stated criterion on the analytic scale may influence the score of other criteria (Van Meore, 2014; Weigle, 2002), then is it not conceivable that an unstated criterion could have a similar effect?
Besides features pertinent to ideas, some of the most frequently cited reasons for overestimations/underestimations from NES included paragraphing (introduction, body, and conclusion). This was in accordance with other literature that found NES were in general agreement when rating ‘organization’ (Englehard, 1992; Green and Hecht, 1985), and that they usually underestimated the criterion when rating NNS student’s writing. Though in this investigation, many of their overestimations were due to the organization as well. This suggests that the criterion is highly important to them, and as a result, was a reason for many significant bias interactions (see Eckes, 2012). For the NNS, however, the quality of vocabulary was one of the most cited reasons for bias interactions, along with features pertinent to ideas. Raters on the most overestimated scripts (i.e., scripts 13 (long sentences), 14 (long sentences) and 4 (short sentences) referred to specific vocabulary items they liked. Most of these words, in my opinion, were either simply less frequently used words than they are accustomed to, or basic linking words (e.g., ‘however’, ‘moreover’, etc.).
They were, nonetheless, clearly impressed which contributed significantly to overestimations. Saeidi et al. (2013) found that ‘vocabulary’ was the most difficult criterion to score. In section 5.8, it was found that scoring the criterion Lexical resource was not so problematic for any of the raters in this investigation. Moreover, none of the NNS raters underestimated the criterion. This could be due to differences between Arab and Iranian raters, or differences in the rating scale itself.
Sentence level features of writing, such as punctuation, did not contribute to biases as greatly as I had expected. Even though features pertinent to grammar, spelling and punctuation were frequently mentioned, for the most part they were not among the main reasons given for overestimations and/or underestimations. In fact, many scripts were criticized for grammatical and spelling mistakes in addition to lack of punctuation, yet they were overestimated (see script 4 (short sentences) and script 14 (long sentences)). This finding could be related to the Ministry of Education’s rubric, which places very little weight on spelling and grammar (2% of the overall score or less, see next paragraph). It could also be attributed to Cumming et al’s. (2002) finding that the more proficient the script, the more weight raters tend to attach to ideas (and the less weight to sentence-level features). This hypothesis is supported by the majority of raters stating that they felt the scripts were more proficient than their student writing.
A final note on the topic of sentence length is in relation to the Ministry of Education-Kuwait scoring rubric. Students are required to write a specific number of sentences on every essay, rather than a specific number of words. Teachers, for instance, are required to award scripts a mark out of ten: 5 for exposition of ideas, paragraphing and number of sentences, 2 for outlining, 2 for spelling and grammar, and 1 for handwriting, spacing and punctuation). Rater 65 (NNS) mentioned that some students deliberately shorten complex sentences in order to fulfill the requirement. She also stated that she deducts marks from students whom she feels have done this, in spite of the fact that she was the most vocal in her expression of preference for short sentences. I think this has a bearing on why some scripts with long sentences were overestimated more than those with short sentences. Short sentences are equated with students who simply want to complete the task whereas long sentences give the impression of a harder-working student (see raters 61, 63 NNS, and 71 NES).
To sum up, the main reasons offered by raters for overestimating/underestimating scripts were chiefly pertinent to its content and ideas, paragraphing and vocabulary. As a result, I conclude that sentence length was not a prominent factor that influenced raters’ scores in this investigation. The most influential factors were, however, problematic and most certainly led to considerable construct-irrelevant variance. It is worth noting here that the term ‘construct-irrelevant variance’ is used slightly loosely. Since the construct of the rating scale does not perfectly map onto the task (see section 4.4.3), then the precise ‘construct’ is not that clear to the raters. However, their task was to rate the scripts using the analytic rating scale, and therefore, the construct of the scale should have been the sole criteria that raters referred to when rating the scripts. It is unfair for students to be penalized for criteria that was not explicitly stated on the scale. For example, degree of creativity or the plausibility of ideas are not part of the writing construct teachers wish to test. Thus, when such factors contribute to test-takers’ score then it is safe to describe these instances as cases of ‘construct-irrelevant variance’. If such factors (creativity, logical reasoning) were going to contribute to the scores test-takers are awarded on their writing, then it is only fair for them to be made aware of this both in their writing classes and on the test/task instructions.
5.12 Chapter 5 summary.
This chapter started out by presenting an exploratory cluster analysis that demonstrated that each group of raters (NES and NNS) had a unique and distinguishable scoring pattern. In the first research question, it was found that raters differed significantly in their severity degrees (p< .001); and both NES and NNS differed significantly amongst themselves in their severity degrees too. Pairwise comparisons of raters on each script showed that there were many cases where a pair of raters would award significantly different scores to the same script. These significant differences also existed between pairs of raters from the same L1 group. The second research question showed that there were many cases of significant bias interaction (t> 2) between rater x script (13.3% of the total terms). The NES, as a rule, systematically awarded higher scores on scripts with short sentences and lower scores on scripts with long sentences whereas the NNS displayed the reverse pattern.
The third research question found that 18.3% of the rater x criteria interaction was significantly biased (t> 2). The majority of those significant bias terms were on the criterion Grammatical range and accuracy, and the minority were on Task achievement. Moreover, pairwise comparisons between raters on each criterion showed that there were numerous statistically significant differences between pairs of raters on each criterion. However, for the most part, the differences here were between NES and NNS. In the fourth research question that explored the bias interaction of all facets (rater x script x criteria), highly significant bias interactions (t> 2.5) were found on each script and criterion. The majority of the significant bias terms were on the criteria Task achievement and Grammatical range and accuracy. During the interviews, namely the second set, the main reasons offered by raters for overestimating/underestimating scripts were chiefly pertinent to its content and ideas, paragraphing and vocabulary. Therefore, sentence length was not a prominent factor that influenced raters’ scores in this investigation. The most influential factors were, however, problematic and most certainly led to considerable construct-irrelevant variance.
Chapter VI
Conclusion
This chapter will begin by summarizing the main aims of the investigation, its methodological features, the findings and an evaluation of its significance and contribution to theory and practice (section 6.1). The limitations of this investigation will be assessed (section 6.2) followed by the implications of this investigation (section 6.3). Finally, areas of further research will be considered (section 6.4). This chapter concludes with a brief summary of the preceding sections (section 6.5).
6.1 Summary of the investigation.
This investigation was launched in order to examine the rating behaviour of two groups of teachers of English in Kuwait: NES and Arab NNS. Moreover, it set out to establish whether long sentence length, a characteristic of the Arabic language, had any influence on either group of raters when rating the scripts using an analytic rating scale. Two types of scripts were analysed: scripts with short sentences on average (12 scripts), and scripts with long sentences on average (12 scripts). The results were quantitatively analysed using the MFRM to investigate: rater severity; rater bias interaction with the two types of scripts; rater bias interaction with the criteria of the analytic scale; and rater bias interaction with both script and criteria. A number of raters participated in two subsequent interviews that were also analysed qualitatively. Thus, this investigation followed a mixed method approach. To overcome some of the limitations found in previous literature (see Hamp-Lyons and Davies, 2008; Johnson and Lim, 2009; Kim and Genaro, 2008; Kondo-Brown, 2002; Lee, 2009), a large pool of raters were used in this investigation (30 NES and 30 NNS).
Initial cluster analyses showed that each group (NES and NNS) was indeed generally distinguishable from the other in terms of their scoring pattern. Results from the MFRM showed that raters significantly varied in their severity degrees. This proved that there was a substantial amount of construct-irrelevant variance. Each group also significantly varied in its severity degree when analysed independently from the other group. That is, there was a significant difference in the severity degrees of the NES, and a significant difference in the severity degrees of the NNS. Thus, even if each group scored the scripts independently, a degree of construct-irrelevant variance would still exist. The rater x script bias interaction showed that the NES scored scripts with short sentences more leniently than the NNS, whereas the reverse occurred with the scripts containing long sentences; the NNS scored them more favourably. Moreover, pairwise comparisons of raters showed that raters differed widely in their overall ratings of the scripts. It was demonstrated that pairing raters to score scripts did not eliminate the construct-irrelevant variance, and in some cases, may have led to an increase.
With regard to rater x criteria bias interaction, there were more significant interactions than between rater x script (18.3% compared to 13.3%). The majority of the significant bias interactions were on the criterion Grammatical range and accuracy (75%). The second highest number of significant interactions was on Coherence and cohesion (13.8%), then Lexical resource (9%). Task achievement had the lowest amount of significant interactions (2.2%). The pairwise comparisons highlighted these findings further as the majority of significant differences between pairs of raters were found on the criterion Grammatical range and accuracy. Moreover, unlike the previous pairwise comparison (raters x script), very few significant differences were found between raters who share the same native status. This finding demonstrated that raters can differ in their severity degrees using the same rating scale, resulting in much construct-irrelevant variance. In the final bias interaction of rater x script x criteria, the majority of significant interactions were found on the criteria Grammatical range and accuracy and Task achievement.
Interviews with 14 participants who rated 12 scripts (six containing short sentences and six containing long sentences) demonstrated that sentence length was not a factor per se that influenced their ratings. The main factor that caused bias interactions was pertinent to the ideas presented (the variety, the detail, the plausibility). Other influential factors included organization (introduction + body + conclusion) for the NES, and vocabulary for the NNS.
This investigation contributes to our understanding of rater behaviour in general and of Arab NNS raters behaviour in particular, in the context of Kuwait. Previous studies that have examined the rating behaviour of NNS did not include Arab raters. This investigation complements the work of Hinkel (1994), Kobayashi and Rinnert (1996), and Land and Whitely (1989) that found that NNS generally scored writing containing features of their L1 more favourably than NES. This investigation, however, utilized a more advanced and sophisticated method, MFRM. Whereas some researchers have come to the conclusion that NES are more lenient raters of writing than NNS, this investigation found that leniency (or severity) is a product of other factors in the assessment setting. Each group showed a level of leniency dependent on the characteristics of the script. Moreover, individual raters within each group varied significantly, meaning that unconditional generalizations on group severity are far from accurate. Thus, the question of ‘who is the more lenient (or severe) rater?’ should be answered with ‘it depends’.
The result of this investigation is a useful addition to previous literature that has compared native to non-native raters using the MFRM. The drawback to previous investigations was the low number of non-native participants which resulted in lack of definitive or clear conclusions (Hamp-Lyons and Davies, 2007; Johnson and Lim, 2009; Kim and Gennaro, 2012; Lee, 2009).
This investigation also confirmed that variance in test-takers’ scores is not due to writing ability alone, but rather to factors related to the rater. This indicates that some construct-irrelevant variance in the test scores is due to rater variance. If decisions about test-takers are to be made based on their scores on rater-mediated assessments, then test developers need to consider this variance in a serious manner. The ultimate goal is to report scores that are meaningful, useful, and fair to test-takers. One solution, based on this as well as other investigations’ findings, is to employ MFRM, and the other is to train the raters.
Specifically, this investigation can be added to a growing body of literature that advocates the use of MFRM in rater-mediated assessment settings to account for rater variance, along with other factors that result in systematic rater variance (see Engelhard, 1992 and 1994; McNamara, 1996; Eckes, 2011, 2012; Weigle, 1998; Saeidi et al., 2013). The standard approach to dealing with rater variance has its limitations (see section 2.7). It cannot account for systematic rater severity or systematic rater bias patterns. The use of MFRM helps paint a much clearer picture of test-takers’ writing ability along with rater effects and rater interaction with other factors (facets) such as the rating scale criteria. MFRM is not normally employed in testing settings for practical reasons (Bond and Fox, 2007; McNamara, 1996). However, in high-stakes tests where the scores obtained from test-takers are used to make life-changing decisions, it should be a prerequisite. Nearly 20 years ago, McNamara noted how findings of significant differences between raters in terms of their overall severity were constant.
He stated that we must conclude that “assessment procedures in performance tests which rely on single ratings by trained and qualified raters are hard to defend” (ibid: p.235). Sadly, many educational institutes continue to ignore or adequately deal with the issue of rater variance (Bond and Fox, 2007; Eckes, 2011).
6.2 Limitations.
This investigation is not without its share of limitations, especially in the methodological stage, and the qualitative analysis of interviews I. In my eagerness to ensure participants’ anonymity and confidentiality, all data collected from participants was placed in envelopes and sealed with no documentation that would trace back to the participants. This was regrettable in hindsight after running the quantitative analyses, especially the cluster analysis and MFRM analyses. The cluster analysis showed that 7 NNS were distinctly unique to other NNS in their scoring pattern.
They were placed in a cluster between the NES and NNS, indicating that they shared scoring patterns with both groups. It would have been of great interest to analyse these raters and examine them further to establish reasons behind their scoring patterns. Moreover, after running the MFRM analyses, it became apparent that it would have been more prudent had the interviews been structured based on the findings of the analyses. In this case, each rater would have been presented with the scripts they systematically overestimated or underestimated followed by a discussion as to the trigger for this rating behaviour. Another source of intrigue was the NES raters who overestimated (systematically scored more leniently) scripts with long sentences as well as the NNS who underestimated (systematically scored more severely) scripts with long sentences. Both of these small groups displayed the reverse bias pattern of their respective groups. Of further interest, the unexpected response tables merit additional investigation of a qualitative nature. This table displayed scores that were a mismatch between scores awarded and scores expected by the model. Green (2013) believes that these scores could be a result of something about the script that may have triggered an emotional response in the rater. It would be insightful if raters could share their thoughts on these unexpected responses.
In an attempt to overcome this limitation a second set of interviews were conducted with 14 raters (10 NNS and 4 NES). This time, the raters were asked to score the scripts and then immediately after they took part in an interview to discuss their scores (namely their overestimations/underestimations). However, a slightly different bias interaction pattern emerged here. This, I would argue, was a result of a change in rating context (i.e., rating at home knowing the scores they award cannot be traced back to them vs rating at school, in the presence of a researcher who will discuss the scores with them).
The second limitation is the manner in which scripts were chosen for the investigation. A selection of 24 scripts was made from a pool of approximately 80 scripts. The criterion for selection was the average length of sentences. This led to scripts being chosen that were at the opposite ends of the spectrum; the shortest sentences and the longest sentences. It may have been wiser to have chosen a wider variety of scripts that gradually increased in average sentence length. For example, 5 scripts with 10-15 words on average per sentence, 5 scripts with 16-20 words on average, 5 scripts with 21 25 words on average, 5 scripts with 26-30 words on average and 5 scripts with +30 words on average. This would have permitted numerous correlation analyses, like Quantile regression, an exciting new/old statistical procedure regaining popularity in the field of language testing (see Chen and Chalhoub-Deville, 2013). This statistical procedure would enable the examination of: (1) how much
of the overall variance in scores can be explained by average sentence length, and (2) how much of the variation in scores for each individual rater group (NES and NNS) could be explained by the average length of sentences. Moreover, had the scripts been selected in the aforementioned manner, MFRM may have produced more meaningful results. The main contention with the way the scripts were collected is that each group exhibited opposing behaviour on each script type. This led to either group cancelling the other out. Also, because each group’s scoring behaviour cancelled the other out, the model could not produce a meaningful ‘fair score’ for each script. Furthermore, from the outset, I was interested in investigating issues pertinent to rater variance in the end-of-term high school exam of English, in Kuwaiti government schools (the equivalent of college in the UK). Unfortunately, this was not feasible for practical (and political) reasons. Analysing raters’ performance on ‘real’ tests could exhibit different behaviour than in a purely experimental research setting. Raters may exhibit different severity degrees based on the stakes of the test, i.e., high stakes and low stakes (Green, 2015, personal correspondence). Thus, it is a matter of conjecture as to how these raters would have behaved and their motivation had they felt the consequence for the test-takers in a real assessment setting.
6.3 Implications.
This investigation has some implications in three main domains: (1) advocating the implementation of MFRM in writing assessment settings, (2) understanding rater behaviour, and (3) the practice of writing assessment in Kuwait.
Despite the fact that research over the last two decades has highlighted the importance of MFRM in rater-mediated assessment settings, and illuminated how factors (facets) other than test-takers’ abilities contribute to variance in scores (Eckes, 2005 and 2011; Engelhard, 1992 and 1994; Johnson and Lim, 2009; Kim and Gennaro, 2012; Kondo-Brown, 2002; Lee, 2009; Lumley, 2005; McNamara, 1996; Saeidi et al., 2013; Weigle, 1998), the tool remains under-used to this day. When test-takers’ writing ability is assessed, the only cause of variance in test scores should be the test-takers’ writing ability. However, due to the subjective nature of rater-mediated assessment, external factors could also contribute to variance. This investigation demonstrated that three external factors, unrelated to the writing construct, had influenced the scores: rater severity, script type (short sentences vs long sentences), and rating scale criteria. The investigation also demonstrated that the interaction between these facets can result in systematic and significant overestimations and underestimations. The best way to avoid these issues is the implementation of the MFRM in such settings. This will allow testers to measure the influence each facet had on the scores awarded, and thus contribute greatly to a writing test’s validity argument. The standard approach to dealing with rater variance, i.e., multiple ratings and establishing a high inter-rater reliability, has proven futile. Van Moere (2014) suggests that multiple ratings should include NES and NNS to counter any one group’s biases. This is not always straightforward as it has been found that some NES can behave in a very NNS manner and vice versa. The NNS in Johnson and Lim (2009), for instance, were very native-like. Though the NNS in this investigation generally displayed unique scoring patterns and bias interactions, there were many individual cases where a native would behave in a very non-native manner and vice versa, as evident in the pairwise comparisons. More importantly, randomly assigning a pair of native and non-native raters to score writing may not negate either’s biases, but rather substantiate it. If both raters have been shown to be systematically more severe or lenient, then a combination of their ratings results is an underestimation or overestimation respectively. Either way, the combined score approach contributes very little to the validity argument of a writing test. Pairing native and non native raters can only work if there is a clear picture of their severity degrees and their bias patterns, which is only feasible via MFRM.
Over 20 years ago, Alderson and Buck (1993) demonstrated how many language tests failed to meet some fundamental testing criteria. About a decade later, Weir (2005) lamented how the situation, by and large, had not really changed. Another decade has passed and it would seem that many language tests still fail to meet basic testing requirements. An example relevant to the setting and context of this investigation would be the end of term English exams in Kuwaiti government high schools. As mentioned in chapter 1, English is one of the main subjects taught at schools in Kuwait from year 1 through to year 12 (final year in high school). Students’ performances in the final three years of school (years 10, 11 and 12) are crucial for their future job/academic careers as they are graded on all the subjects they study and those grades contribute to their Grade Point Average (GPA). Thus, any test during that three-year period is, by definition, a high-stakes test. At the end of each term (4 terms in total) students are required to sit a two and a half – three-hour achievement test. The test consists of a number of sections, reading comprehension, translation, vocabulary, grammar and writing. In the writing section, students are required to write an essay that is three paragraphs long and comprises 12-14 sentences and approximately 140-160 words, which contributes to 32% of their overall exam grade. The topics given to the students vary: argumentative, emails, chart reading, writing a report, etc. The criteria by which students are rated are: (1) exposition of ideas and paragraphing, (2) pre-writing techniques (brainstorming, mind mapping, outlining), (3) spelling and structure, (4) handwriting, spacing and punctuation. About 60% of the total score is on the first criterion. Teachers rate the essays and multiple marking procedures are usually, but not always practiced- that is, two raters rate the essay and the supervisor checks for any major discrepancies in scores. When a marked difference between raters is found, then the head teacher or supervisor has the final say on the score a student is awarded. Scores awarded to students are generally taken at face value. However, raters are asked to rate the essays impressionistically. No recognizable rating scale with descriptors is used in the process.
It is hard to make a scoring validity argument in a case like this. There is no clear construct definition apparent in the tests, there are no clear guidelines on the level of performance, no clear descriptors in the form of a rating scale, scoring is done impressionistically, and the meaning of scores to test takers (students) is vague to say the least. Knowing that students’ futures are shaped based on their scores in these examinations, one hopes for a more vigorous validation approach. It has been demonstrated in this investigation that these raters (teachers) systematically and significantly differed in their severity degrees, and on the whole, were more severe as raters than the NES. Thus, students’ scores on the writing section of the end of term English examinations are likely to be: (a) underestimations of their true writing abilities and more crucially (b) lead to an unfair drop in their GPA. This in turn has major consequences for their future academic or job careers.
One step in the right direction would be training a number of teachers to score only the writing section of the exams as opposed to sharing rating responsibilities amongst all teachers. All the teachers in the department can participate in a rater training/moderation session. A number of teachers will subsequently be selected from this session based on their ‘fit statistics’ on the MFRM. These teachers then assume responsibility for scoring the writing section of the exams, and the remainder score the other sections. Pairs of the selected raters score each script independently and randomly. Their scores are then uploaded to the FACETS software. This will adjust students’ scores to account for rater severity. This would also be beneficial for their monitoring and training by
sharing their rating behaviour and tendencies with them. Moreover, there is a false belief amongst teachers in Kuwait that the more experienced teacher is, by definition, the more qualified rater. Yet, Van Moere (2014) notes that many experienced and qualified teachers struggle with rating performances accurately and consistently, and that rating is somewhat a talent that some teachers are simply better at than others (p.3). Implementing this, I believe, will contribute immensely to the issue of rater variance, and in turn ensure the fairness of students’ scores on the writing section of the exam. This step, however, is only part of a posteriori approach to validation and will not negate the need for a priori validity argument that these end of term exams lack.
In addition, an adequate rating scale with specified criteria and proper discriptors, as opposed to the current secodnry school writing rubric, needs to be developed that takes into account the writing curriculum of the Ministry of Education in Kuwait and teachers’ beliefs regarding the importance of certain writing features. Developing such a scale is by no means an easy task, and should be undertaken by a team of external language testers and internal teachers from various secondary schools. This scale should be validated quantitatively by means of MFRM, namely by observing the rating scale functioning report to help arrive at an adequate number of scores (levels), and qualitatively by gathering data that sheds light on teachers’ perception of the scale. The work of Knoch (2009), I believe, provides a useful blueprint to follow. Even though her scale was developed for diagnostic purposes, the steps and procedures she lays out certainly do apply to rating scale development for end-of-term achievement test purposes.
One model the Ministry of Education in Kuwait could follow is that of the Common Educational Proficiency Assessment (CEPA) in English, which is a high stakes proficiency/placement test administered to students in their final year of secondary school (high school/Grade 12) in the United Arab Emirates. Even though the test has areas that need further development, like the introduction of a listening and speaking section (see Coombe and Davidson, 2014), the test nonetheless makes a strong scoring validity argument in the writing section. It utilizes both the standard approach and measurement approach to deal with rater variance (see sections 2.8.1 and 2.8.2). Raters are trained to use a 6-point analytic rating scale that has been specifically designed for the test tasks. Each script is double-blind rated by a pair of raters online, and if a discrepancy of score is noted a third qualified rater is assigned to rate the script. Moreover, raters’ performance is constantly monitored by means of MFRM to observe rater consistency and severity.
Finally, the results of this investigation, I believe, should be included in any literacy assessment project in Kuwait.
6.4 Areas of further research.
Messick (1989) describes validity and validation as an ‘evolving property’ and a ‘continuous process’ (p.13). The constant nature of evolution in language testing means that further research to substantiate claims that are made about tests (and test scores) is always warranted (Bachman and Palmer, 2010). The need to test language performance (i.e., writing and speaking) directly entails the need for human raters in most cases. With human raters comes score variance, resulting in some construct-irrelevant variance in test scores. Thus, sources of rater variance need to be further understood and accounted for. This is best done by mixed method approaches that analyse how raters vary quantitatively and qualitatively (Turner, 2014; Van Moere, 2014). Identifying various rater characteristics (psychological (i.e., personal) and experiential), and text characteristics that result in raters behaving in a unique way as a group, is merely the first step. Further qualitative investigations need to be carried out to understand the cognitive processes that influence rater behaviour and decision-making processes, and more importantly whether different approaches to decision-making lead to systematic and significant rater varaiance.
Moreover, the majority of writing assessment research focused on contexts in the US, and there is a need for more research to be carried out in other contexts, namely in the Arab world (Crusan, 2014; Gebril and Hozayin, 2014). Investigations of the rating behaviour of Arab (NNS) teachers of English are scarce. This is something that needs to be addressed if the scoring of high-stakes tests in the Arab world, and Kuwait in particular, is the responsibility of teachers. Investigations into the influence rater training may have on Arab raters, as well as their rating behaviour in relation to particular types of tasks and particular types of rating scales, should be carried out. There are also concerns that in the Arab world, there is little awareness of issues pertinent to fairness of test scores, and no transparency in test validation processes (Gebril and Taha-Thomure, 2014). From an ethical perspective, stakeholders, especially students, need to be aware of matters pertaining to the meaning and fairness of test scores. This can only change when further validation investigations are carried out in that part of the world and an AUA is implemented in assessment settings.
In addition, there is anecdotal evidence that raters exhibit systematic and significant biases when rating scripts written by test-takers of extremely high or low abilities (Kond-Brown, 2002; Saeidi et al., 2013; and Schaefer, 2008). This was also observed in this investigation; much bias interaction and unexpected responses were found on script 6 (short sentences), which was awarded the highest scores. However, this was the only script of extreme ability (in comparison to the other scripts). It is perhaps worth investigating raters’ biases by presenting them with a sample of scripts with a matching number of abilities on each level. For example, raters could be asked to rate 25 scripts; 5 by extremely low ability test-takers, 5 by low ability test-takers, 5 by average ability test-takers, 5 by high ability test-takers, and 5 by extremely high ability test-takers. An investigation could then be undertaken which documents raters’ severity on each group together with their biases and pairwise comparisons. The outcome would reveal whether it is a point of fact that raters exhibit more biases on extremely high and low ability test-takers.
Another area in particular that warrants further investigation is raters’ personal perception of quality writing and the scores they award scripts when using an analytic scale. Eckes (2012) found that raters displayed biases towards the criteria they felt were most important on the analytic scale. Lumley (2002, 2005) reports a struggle between raters’ complex impression of written scripts and the descriptors of the analytic rating scale (see also Sakyi, 2000; and Smith, 2000, cited in Barkaoui, 2010). In the retrospective interviews of this investigation, a number of raters cited reasons and qualities that were not explicitly mentioned on the rating scale as to why they scored some scripts higher than others (most notably plausibility). This resulted in some construct-irrelevant variance and an argument against Claim 4 of the AUA. It is, in my opinion, worth dedicating an investigation to the scores raters award scripts using a rating scale, then analysing the unstated criteria/qualities that influenced their judgments in a mixed methods approach. It is possible that raters may exhibit a unique kind of halo effect where an unstated criterion (or criteria), which they perceive as important, could influence their evaluation of the stated criteria on the rating scale. This was certainly the case in this investigation, where raters significantly underestimated scripts containing ideas that raters believed to be implausible or illogical.
Finally, although it was apparent the NES scored scripts with short sentences more favourably than those with long sentences: they stated in subsequent interviews that sentence length was not the reason per se for this observed variance. They cited reasons such as punctuation (or lack of) as to why they scored the scripts with long sentences less favourably. This avenue could be explored further by presenting NES with manipulated scripts comprising authentic long sentences, punctuated by a teacher, and investigating the outcome.
6.5 Chapter 6 summary.
This chapter began by summarizing the aims of the investigation, methodology, findings and significance of its findings (section 6.1). Then it shed light on some of the investigation’s limitations (section 6.2). Lastly, the implications (section 6.3) and areas of further research (section 6.4) were covered.
References
Ahmed, A. (2011). The EFL essay writing Difficulties of Egyptian Student Teachers of English: Implications for Essay Writing Curriculum and Instruction. Unpublished PhD Thesis, University of Exeter: UK.
Al-Nwaiem, A. (2012). An Evaluation of the Language Improvement Component in the Pre-Service ELT Programme at a College of Education in Kuwait: A case study. Unpublished Thesis, University of Exeter: UK.
Alderson C., and Buck, G (1993). Standards in testing: a study of the practice of UK examination boards in EFL/ESL testing. Language Testing, 10(1), pp. 1-26.
Alderson, C., and Hamp-Lyons, L. (1996). TOFEL preparation course: a study of washback. Language Testing, 13(3), pp.280-297.
Al-Taani, A., Msallam, m., and Wedian, S. (2012). A top-down chart parser for analyzing Arabic sentences. Int. Arab J. Inf. Technol., 9(2), pp. 109–116.
Bacha, N. (2001). Writing evaluation: what can analytic versus holistic essay scoring tell us? System, 29, 371-383.
Bachman, L. F. (1990). Fundamental considerations in language testing. Oxford: Oxford University Press.
Bachman, L. F. (2004). Statistical Analyses for Language Assessment. Cambridge: Cambridge University Press.
Bachman, L. F. (2005). Building and supporting a case for test use. Language Assessment Quarterly, 2(1), pp. 1–34.
Bachman, L. F., and Palmer, A. S. (1996). Language testing in practice. Oxford: Oxford University Press.
Bachman, L. F., and Palmer, A. S. (2010). Language Assessment in Practice. Oxford: Oxford University Press.
Baker, B. A. (2012). Individual differences in rater decision-making style: An exploratory mixed- method study. Language Assessment Quarterly 9(3), pp.225-248.
Barkaoui, K. (2010). Variability in ESL essay rating processes: The role of the rating scale and rater experience. Language Assessment Quarterly 7(1), pp. 54-74.
Barkaoui, K. (2011). Effects of marking method and rater experience on ESL essay scores and rater performance. Assessment in Education: Principles, Policies and Practice, 18(3), pp.279-293.
Barkaoui, K. (2014). Multifaceted Rasch Analysis for Test Evaluation. Volume III. In Kunnan, A. J. (ed.), The Companion to Language Assessment. Oxford: John Wiley and Sons Ltd.
Bjork, L., and Raisanen, C. (1997). Academic writing: A university writing course. Lund: Student Literature.
Breland, H. M., and Jones, R. J. (1984). Perception of writing skills. Written Communication 1(1), pp. 101-119.
Bridgman, B. and Carlson, S. (1983). Survey of Academic Writing Tasks Required of Graduate and Undergraduate Foreign Students. TOFEL Research Reports 15. Princeton, NJ: Educational Testing Service.
Briggs, D. (1970). The influence of handwriting on assessment. Educational Research, 13, pp. 50-55.
Briggs, D. (1980). A study of the influence of handwriting upon grades using examination scripts. Educational Review 32(2), pp. 186-193.
Brown, J. D. (1991). Do English and ESL faculties rate writing samples differently? TESOL QUARTERLY, 25 (4), 587 603.
Brown, J. D. (2014). Mixed Methods Research for TESOL. Edinburgh: Edinburgh University Press Ltd.
Brown, J. D. (2015). Mixed Methods Research: Chapter 10. In Brown, J. D. and Coombe, C. (eds.), The Cambridge Guide to Research in Language Teaching and Learning. Cambridge, UK: Cambridge University Press.
Bond, T. G. and Fox, C. M. (2007). Applying the Rasch Model: Fundamental Measurement in the Human Sciences. Mahwah, NJ, Lawrence Erlbaum Associates.
Carr, N. (2010). Designing and Analyzing Language Tests. Oxford: Oxford University Press. Chapelle, C. A., and Voss, E. (2014). Evaluation of language tests through validation research. Volume II. In Kunnan, A. J (ed.), The Companion to Language Assessment. Oxford: John Wiley and Sons Ltd.
Ching, K. H. (2009). Common errors in written English essays of form one Chinese students: A case study. European Journal of Social Sciences, 10 (2), 242-253.
Coffey, A. & Atkinson, P. (1996) Making Sense of Qualitative Data. Thousand Oaks: Sage. Cohen, L., Manion, L., Morrison, K. (2011). Research methods in education. New York: Routledge.
Coombe, C., and Davidson, P. (2014). Test review: Common Educational Proficiency Assessment (CEPA) in English. Language Testing, 31(2), pp. 269-276.
Connor, U., and Carrell, p. (1993). The interpretation of tasks by writers and readers in holistically rated direct assessment of writing. In Carson, J. G., and Leki, I. (eds.), Reading in the composition classroom. Boston, MA: Heinle and Heinle.
Connor-Linton, J. (1995a). Looking behind the curtain: What do L2 composition ratings really mean? TESOL Quarterly, 29, pp. 762-765.
Connor-Linton, J. (1995b). Crosscultural comparison of writing standards: American ESL and Japanese EFL. World Englishes, 14 (1), 99-115.
Crusan, D. (2010) Assessment in the Second Language Writing Classroom. Michigan: University of Michigan.
Crusan, D. (2014). Assessing Writing. Volume I. In Kunnan, A. J (ed.), The Companion to Language Assessment. Oxford: John Wiley and Sons Ltd.
Crystal, D. (1997). The Cambridge Encyclopedia of the English Language. Cambridge: Cambridge University Press.
Cumming, A. (1989). Writing expertise and second language proficiency. Language Learning 39, pp. 81-141.
Cumming, A. (1990). Expertise in evaluating second language composition. Language Testing, 7, pp. 31-51.
Cumming, A., Kantor, R., and Powers, D. (2002). Decision making while rating ESL/EFL writing tasks: A descriptive framework. The Modern Language Journal, 86(1), pp. 67-96.
Cuts, M. (1995). The Oxford Guide to Plain English. Oxford: Oxford University Press.
Davies, E. E. (1983). Error evaluation: the importance of viewpoint. ELT Journal, 37 (4), 304-311.
Davies, A., and Elder, C. (2005). Validity and validation in language testing. In Hinkel, E., (ed.), Hanbook of research in second language teaching and learning (pp. 795-813). Mahwah, NJ: Lawrance Erlbaum Associates.
De Mauro, G. (1992). An investigation of the appropriateness of the TOFEL test as a matching variableto equate TWE topics. TOFEL Research Report 37, Princeton, NJ: Educational Testing Service.
Diederich, P. B. (1974). Measuring Growth in English. Urbana, I1: The National Council of Teachers of English.
Diederich, P. B., French, J. W., and Carlton, S. T. (1961). Factors in Judgments of Writing Quality. Research Bulletin, 61-15, Preston NJ: Educational Testing Sevice.
Dörnyei, Z. (2007). Research Methods in Applied Linguistics. Oxford: Oxford University Press. Douglas, D. (2000). Assessing Language for Specific Purposes: Theory and Practice. Cambridge: Cambridge University Press.
Du, Y., Wright, B. D., and Brown, W. L. (1996, April). Differential facet functioning detection in direct writing assessment. Paper presented at the Annual Meeting of the American Educational Research Association, New York.
Eames, K and Loewenthal, K. (1990) Effects of Handwriting and Examiner’s Expertise on Assessment of Essays. The Journal of Social Psychology 130(6), pp. 831-833.
Eckes, T. (2005). Examining rater effects in Test DaF writing and speaking performance assessments: A Many-Facet Rasch Analysis. Language Assessment Quarterly, 2(3), 197-221.
Eckes, T. (2011). Introduction to Many-Facet Rasch Measurement: Analyzing and evaluating rater- mediated assessments. Frankfurt: Peter Lang.
Eckes, T. (2012). Operational rater types in writing assessment: Linking rater cognition to rater behaviour. Language Assessment Quarterly, 9, pp. 270-292.
Elbow, P. (1993). Ranking, evaluating and liking: Sorting out three forms of judgment. College English, 55, pp. 187-206.
Elder, C. (1992). How do subject specialists construct second language proficiency? Melbourne Papers in Language Testing, 1(1), pp. 17-33.
Engelhard, G. (1992). The measurement of writing ability with a Many-Faceted Rasch Model. Applied Measurement in Education, 5(3), 171-191.
Engelhard, G. (1994). Examining rater errors in the assessment of written compositions with a many- faceted Rasch model. Journal of Educational Measurement, 31(2), pp. 93-112.
Engelhard, G. (1996). Evaluating rater accuracy in performance assessments. Journal of Educational Measurement 33, 56–70.
Everitt, B. S., Landau, S., Morven, L., and Stahl, D. (2011). Cluster Analysis. UK: John Wiley and Sons, Ltd.
Ferris, D. R., and Hedgcock, J. S. (2005). Teaching ESL Composition: Purpose, Process and Practice. NJ: Lawrence Erlbaum Associates, Inc.
Ferris, D. R., and Hedgcoc, J. S. (2014). Teaching L2 Composition: Purpose, Process, and Practice. NY: Routledge.
Friedman, D. (2012). How ro Collect and Analyze Qualitative Data. In Mackey, A., and Gass, S. (eds) Research Methods in Second Language Acquisition: A Practical Guide. West Sussex: Blackwell Publishing Ltd.
Fulcher, G. (2003). Testing Second Language Speaking. NY: Routledge.
Fulcher, G. (2010). Practical Language Testing. Oxford: Oxford University Press.
Fulcher, G. ad Davidson, F. (2007). Language Testing and Assessment: An advanced resource book. NY: Routledge.
Gass, S. M., and Mackey, A. (2000). Stimulated recall methodology in second language research. England: Multilingual Matters.
Gebril, A. and Hozayin, R. (2014). Assessing English in the Middle East and North Africa. Volume IV. In Kunan, A. J (ed.), The Companion to Language Assessment. Oxford: John Wiley and Sons Ltd.
Gebril, A. and Taha-Thomure, H. (2014). Assessing Arabic. Volume IV. In Kunan, A. J (ed.), The Companion to Language Assessment. Oxford: John Wiley and Sons Ltd.
Grabe, W. and Kaplan, R. (1996). Theory and Practice of Writing. London: Longman. Green, B. (2008). Book Review. Journal of Educational Measurement Summer 2008, 45(2), pp. 195– 200.
Green, P. S. (1975). The Language Laboratory in School- The York Study. Edinburgh: Oliver and Boyd.
Green, P. S., and Hecht, K. (1985). Native and non-native evaluation of learners’ errors in written discourse. System, 13 (2), pp. 77-97.
Green, R. (2013). Statistical analysis for language testing. UK: Palgrave Macmillan. Hacht, E. and Lazaraton, A. (1991). The research manual: Design and statistics for applied linguistics. New York: Newbury House.
Hamp-Lyons, L. (1990). Second language writing: Assessment issues. In Kroll, B. (ed.), Second Language Writing: Research Insights for the Classroom. Cambridge: Cambridge University Press, pp.68-87.
Hamp-Lyons, L. (1991). Assessing Second Language Writing in Academic Contexts. NJ: Ablex Publishing Corporation.
Hamp-Lyons, L. (1995). Rating nonnative writing: The trouble with holistic scoring. TESOL Quarterly, 29, pp. 759 62.
Hamp-Lyons, L. (2007). Worrying about rating. Assessing Writing 12, pp.1-9.
Hamp-Lyons, L., & Davies, A. (2008). The Englishes of English tests: Bias revisited. World Englishes, 27(1), pp. 26-39.
Harsch, C., and Martin, G. (2013). Comparing holistic and analytic scoring methods: isses of validity and reliability. Assessment in Education: Principles, Policy & Practice, 20(3), pp. 281-307.
Heddadin, A., Dweik, B., and Sheir, A. (2008). Teachers’ and Students’ Perception of the Effect of Public Examinations on English Instruction at the Secondary Stage in Jordan. Jordanian Journal of Applied Science, 11(2), pp. 331-344.
Henning, G. (1987). A Guide to Language Testing: development, evaluation, research. Cambridge, MA: Newbury House.
Hermanowicz, J. (2002). The great interview: 25 strategies for studying people in bed. Qualitative Sociology 25(4), pp. 479-499.
Hill, K. (1996). Who should be the judge? The use of non-native speakers as raters on a test of English as an international language. Melbourne Papers in Language Testing, 5, pp. 29–50.
Hinkel, E. (1994). Native and nonnative speakers’ pragmatic interpretations of English texts. TESOL Quarterly, 28 (2), 353-376.
Hughes, A., and Lascaratou, C. (1982). Competing criteria for error gravity. ELT Journal, 36 (3), pp. 175-181.
Hughes, A. (2003). Testing for Language Teachers. Cambridge: Cambridge University Press.
Huot, B. (1988). The validity of holistic scoring: A comparison of talk-aloud protocols of expert and novice holistic raters. Unpublished PhD dissertation, Indian University of Pennsylvania: US.
Huot, B. (1993). The influence of holistic scoring procedures on reading and rating student essays. In Williamson, M., M., and Huot, B (eds.) Validating holistic scoring for writing assessment: Theoretical and empirical foundations. Cresskill, NJ: Hampton Press, Inc. pp.
Hyland, K. (2002). Teaching and researching writing. Harlow, England: Longman Hyland, K. (2003). Second language writing. NY: Cambridge University Press.
Hyland, K. and Anan, E. (2006). Teachers’ perception of error: the effects of first language and experience. System, 34, pp. 509-519.
Hyland, F., and Hyland, K. (2001). Sugaring the pill: Praise and criticism in written feedback. Journal of Second Language Writing, 10 (3), 185-212.
Jacobs, H.L., Zinkgraf, S.A., Wormuth, D. R., Hartfiel, V. F., and Hughey, J.B. (1981). Testing ESL composition: A practical approach. Rowley, MA: Newbury House.
James, C. (1977). Judgments of Error Gravities. ELT Journal, 31 (2), 116-124.
Johnson, J. S., & Lim, G. S. (2009). The influence of rater language background on writing performance assessment. Language Testing, 26(4), pp. 1-21.
Johnson, R., and Onwuegbuzie, T. (2004). Mixed methods research: A research paradigm whose time has come. Educational Researcher, 33(7), pp. 14-26.
Johnson, R., Onwuegbuzie, T., and Turner, L. (2007). Towards a definition of mixed methods research. Mixed Methods research, 1(2), pp. 144-145.
Kane, M. T. (2006). Validation. In Brennen, R. (ed.), Educational measurement (4th ed., pp. 17–64). Westport, CT: Greenwood Publishing.
Khalil, A. (1985). Communicative error evaluation: native speakers’ evaluation and interpretation of written errors of Arab EFL learners. TESOL Quarterly, 19 (2), pp. 334- 351.
Khuwaileh, A. and Shoumali, A. (2000). Writing Errors: A Study of the Writing Ability of Arab Learners of Academic English and Arabic at University. Language, Culture and Curriculum, 13 (2), pp.174-183.
Kim, A, and Genaro, K. (2012). Scoring Behavior of Native vs. Non-native Speaker Raters of Writing Exams.
Language Research, 8, pp. 319-342.
Knoch, U. (2009). Diagnostic Writing Assessment. Frankfurt: Peter Lang.
Kobayashi, T. (1992). Native and nonnative reactions to ESL compositions. TESOL Quarterly, 26(1), pp. 81-112.
Kobayashi, H. & Rinnert, C. (1996). Factors affecting composition evaluation in an EFL context: Cultural rhetorical pattern and readers’ background. Language Learning, 46(3), pp. 397-437.
Kondo-Brown, K. (2002). A FACETS analysis of rater bias in measuring Japanese L2 writing performance. Language Testing, 19 (1), 3-31.
Lado, R. (1961). Language Testing. London: Longman.
Land, R. E., and Whitely, C. (1989). Evaluating second language essays in regular composition classes: Towards a pluralistic U.S. In Johnson, D. M., and Roen, D. H. (eds.), Richness in writing: Empowering ESL students. New York: Longman.
Lee, H.K. (2009). Native and non-native rater behavior in grading Korean students’ English essays. Asia Pacific Education Review, 10 (3), 387-397.
Linacre, J. M. (1989). Many-facet Rasch measurement. Chicago: MESA Press.
Linacre, J, (2012). Practical Rasch Measurement. Retrieved from www.winsteps.com/tutorials.htm. Lumley, T. (2002). Assessment criteria in a large-scale writing test: what do they really mean to raters? Language Testing, 19(3), pp. 246-276.
Lumley, T. (2005). Assessing second language writing: The rater’s perspective. Frankfurt am Main: Peter Lang.
Lumley, T., & McNamara, T. F. (1995). Rater characteristics and rater bias: Implications for training. Language Testing, 12(1), 54-71.
Lunz, M. E., and Stahl, J. A. (1990). Judge consistency and severity across grading periods. Evaluation and the Health Professions, 13, pp.425-44.
Lynch, B.K., and McNamara, T.F. (1998). Using G-theory and many-faceted Rasch measurment in the development of performance assessment of the ESL speaking skills of immigrants. Language Testing, 15, pp. 158-180.
Mackey, A. & Gass, S. (2005) Second Language Research: Methodology and Design. Mahwah: Lawrence Erlbaum Associates.
Massey, A (1983). The Effect of Handwriting and other Incidental Variables on GCE ‘A’ level Marks in English Literature. Educational Reviews 35(1) pp. 45-50
McNamara, T.F. (1996). Measuring second language performance. New York: Longman.
McNamara, T. F. (2000). Language Testing. Oxford: Oxford University Press.
Mendelsohn, D. and Cumming, A. (1987). Professors‘ ratings of language use and rhetorical organization in ESL compositions. TESL Canada Journal, 5(1), pp. 9-26.
Messick, S. (1989). Validity. In R. Linn (ed.), Educational Measurement. New York: Macmillan.
Messick, S. (1994). The interplay of evidence and consequences in the validation of performance assessments. Educational Researcher, 23(2), pp. 13-23.
Messick, S. (1996). Validity and washback in language testing. Language Testing, 13(3), pp. 241-256.
Milanovic, M., Saville, N., and Shen, S. (1996). A study of the behavior of composition markers. In Milanovic, M., and Saville, N (ed.), Performance testing, cognition and assessment: selected papers from the 15th Annual Language Testing Research Colloquim (LTRC), Cambridge and Arnhem (pp. 92-114). Cambridge UK: Cambridge University Press.
Mislevy, R. J., and Chengbin, Y. (2009). If language is a complex adaptive system, what is language assessment? Language Learning, 59(1), pp. 249-267.
Mohammed, A. (2005). Collocation errors made by Arab learners of English. Asian EFL Journal.Teachers Articles, 5(2), pp. 117-126.
Mohammed, A., and Omer, R. (1999). Syntax as a marker of rhetorical organization in written texts: Arabic and English. International Review of Applied Linguistics in Language Teaching, 37(4), pp. 291-305.
Monte, M. and Malone, M. (2014). Writing Scoring Criteria and Score Reports. Volume II. In Kunan, A. J. (ed.), The Companion to Language Assessment. UK: John Wiley and Sons, Inc.
Myford, C. M., and Wolfe, E. W., (2004). Detecting and measuring rater effects using many-faceted Rasch measurment: Part II. In E. V. Smith and R. M. Smith, (Eds.), Introduction to Rasch measurment, (pp.518-574), Maple Grove, MI: JAM Press.
Nickel, G. (1973). Aspects of error evaluation and grading. Svartvik, 1973, pp. 8-24.
Noor, H. H. (1996). English Syntactic Errors By Arabic Speaking Learners: Reviewed. The Fourth International Symposium on Language and Linguistics. Thailand, 1441-1465. Institute of Language and Culture for Rural Development, Mahidol University
O’Loughlin, K. (1992). The assessment of writing by English and ESL teachers. Unpublished MA thesis, The University of Melbourne: Australia.
O’Neill, T.R., and Lunz, M.E. (1996). Examining the invariance of rater and project calibrations using multi-faceted Rasch model. Paper presented at the Annual Meeting of the American Educational Research Association, New York.
O‘Sullivan, B., & Rignall, M. (2007). Assessing the value of bias analysis feedback to raters for the IELTS writing module. In L. Taylor & P. Falvey (eds.), IELTS collected papers. Research in speaking and writing performance (pp. 446-478). Cambridge: Cambridge University Press. Othman, E., Shaalan, K., and Rafea, A. (2004). Towards Resolving Ambiguity in Understanding Arabic Sentence. Presented at the International Conference on Arabic Language Resources and Tools, NEMLAR, Egypt.
Perkins, K. (1980) Using Objective Measures of Attained Writing Proficiency to Discriminate Among Holistic Evaluations. TESOL Quarterly 14, pp. 61-69.
Phakiti, A. (2003). A closer look at the relationship of cognitive and metacognitive strategy use to EFL reading achievement test performance. Language Testing, 20(1), pp. 26-56.
Porte, G. (1999). Where to draw the red line: Error toleration of native and non-native EFL faculty. Foreign Language Annuals, 32(4), pp. 426-434.
Powers, D. E., Fowles, M. E., Farnum, M., and Ramsey, P. (1994). Will they think less of my handwritten essay if others word process theirs? Effects on essay scores of intermingling handwritten and word-processed essays. Journal of Educational Measurement 31(3), pp.220 233.
Rasch, G. (1960). Probabilistic models for some intelligence and attainment Tests. Copenhagen: Danish Institute for Educational Research.
Revesz, Andrea (2012). Coding second language data: Validity and reliability. In Mackey, A., and Gass, S. (eds.). Research methods in second language acquisition. West Sussex, UK: Blackwell Publishing Ltd.
Richards, J. (1971). Error analysis and second language strategies. Paper read at Indiana University, Bloomington.
Ruth, L., and Murphy, S. (1988). Designing writing tasks for the assessment of writing. Norwood, NJ: Ablex).
Saeidi, M., Yousef, M., and Baghayei, P. (2013). Rater Bias in Assessing Iranian EFL Learners’ Writing Performance. Iranian Journal of Applied Linguistics, 16(1), pp.145-175.
Sakyi, A. (2000). Validation of holistic scoring for ESL writing assessment: How raters evaluate ESL compositions. In Kunnan, A (ed.). Fairness and validation in language assessment. Cambridge: Cambridge University Press.
Santos, T. (1988). Professors’ reactions to the academic writing of nonnative-speaking students. TESOL Quarterly, 22(1), 69-90.
Sanyal, J. (2006). INDLISH: The Book for Every English-Speaking Indian. New Delhi: Viva Books Private Limited.
Sasaki, M. (2014) Introspective Methods. Volume III. In Kunnan, A. J. (ed.), The Companion to Language Assessment. UK: John Wiley and Sons, Inc.
Schaefer, E. (2008). Rater bias patterns in an EFL writing assessment. Language Testing, 25(4), pp. 465-493.
Scott, M. S. and Tucker, G. R. (1974) Error analysis and English language strategies of Arab students. Language Learning 24, pp. 123-134.
Shaw, S. D., and Flavey, P. (2007). The IELTS Writing Assessment Revision Project: Towards a revised rating scale, Cambridge ESOL Web-Based research Report 1.
Shaw, S. D., & Weir, C. J. (2007). Examining writing: Research and practice in assessing second language writing. Cambridge: Cambridge University Press.
Sheory, R. (1986). Error perception of native-speaking and non-native-speaking teachers of ESL. ELT Journal 40 (4), pp. 306-312.
Shi, L. (2001). Native- and nonnative-speaking EFL teachers ‘evaluation of Chinese students’ English writing. Language Testing, 18(3), pp. 303-325.
Shohamy, E., Gordon, C.M. and Kraemer, R. (1992). The effects of raters’ background and training on the reliability of direct writing tests. Modern Language Journal, 76, pp. 27-33.
Song, B., and Caruso, I. (1996). Do English and ESL faculty differ in evaluating the essays of native English speaking and ESL students? Journal of Second Language Writing, 5(2), pp. 163-182.
Stock, P. L., and Roninson, J. L. (1987). Taking on testing. English Education 19, pp. 93-121. Subramaniam, D. (2009). Error Analysis of Written English Essays of Secondary School Students in Malaysia: A Case Study. European Journal of Social Sciences, 8 (3), pp. 483-495.
Sweedler-Brown, C. O. (1993). ESL essay evaluation: The Influence of sentence-level and rhetorical features. Journal of Second Language Writing, 2(1), pp. 3-17.
Takashima, H. (1987). To what extent are non-native speakers qualified to correct free compositions: a case study. British Journal of Language Teaching, 25, pp. 43-48.
Turner, C. (2014). Mixed Methods Research. Volume III. In Kunnan, A. J. (ed.), The Companion to Language Assessment. UK: John Wiley and Sons, Inc.
Van Moere, A. (2014) Raters and Ratings. Volume III. In Kunnan, A. J. (ed.), The Companion to Language Assessment. UK: John Wiley and Sons, Inc.
Vaughan, C. (1991). Holistic assessment: What goes on in the rater’s mind? In L. Hamp-Lyons (Ed.), Assessing second language writing in academic Contexts, pp. 111–125. Norwood, NJ: Ablex.
Weigle, S. C. (1994). Effects of training on raters of ESL compositions. Language Testing, 11(2), pp. 197-223.
Weigle, S. C. (1998). Using FACETS to model rater training effects. Language Testing, 15(2), pp. 263-87.
Weigle, S. C. (1999). Investigating rater/prompt interactions in writing assessment: quantitative and qualitative approaches. Assessing Writing, 6 (2), pp. 145-178.
Weigle, S. C. (2002). Assessing Writing. Cambridge: Cambridge University Press.
Weigle, S. C. (2007). Teaching writing teachers about assessment. Journal of Second Language Writing, 16, 194 209.
Weir, C (1983). Identifying the language prolems of oversea students in tertiary education in the United Kingdom. Unpublished PhD dissertation, University of London: UK.
Weir, C. J. (1990). Communicative language testing. NJ: Prentice Hall Regents.
Weir, C. J. (1993). Understanding and Developing Language Tests. UK: Prentice Hall.
Weir, C. J. (2005). Language testing and validation: An evidence-based approach. Hampshire, UK: Palgrave Macmillan.
Weir, C. J. (2013). The measurement of writing ability 1913-2012. In Weir, C., Vidakovic, I., and Galaczi, E, D. (eds.), Measured Constructs: A history of Cambridge English language examinations 1913-2012. Studies in Language Testing 37. Cambridge: Cambridge University Press.
White, E. M. (1995). An apologia for the timed impromptu essay test. College Composition and Communication, 46(1), pp.30-45.
Wigglesworth, G. (1993). Exploring bias analysis as a tool for improving rater consistency in assessing oral interaction. Language Testing, 10, 305-335.
Winke, P., Gass, S., and Mayford, C. (2011). The Relationship Between Raters‘ Prior Language Study and the Evaluation of Foreign Language Speech Samples. ETS Research series, 2, pp. 1-67.
Winke, P., Gass, S., and Mayford, C. (2012). Raters’ L2 background as a potential source of bias in rating oral performance. Language Testing, 30(2), pp. 231-252.
Yamani, M. (2000). Changed identities: The challenge of the new generation in Saudi Arabia. Royal Institute of International Affairs: London.
Appendices:
Appendix 1 Information letter and consent.
The University of Sheffield. How to even the score: A comparison of Native
Information School work. and Non-native Speakers’ evaluation of written
Researcher
Saleh Ameer.
egp11sja@sheffield.ac.uk
(+44)07541819474
Purpose of the research
This study investigates the differences between Native English and Non-native English teachers’ evaluation of written work. It will also assess factors that influence the process of scoring written work.
Who will be participating?
Native and non-native teachers of English as a second or foreign language, working at various educational institutes in Kuwait.
What will you be asked to do?
Participants will be asked to rate 24 written scripts using an analytic scale, then mention what they liked and found problematic with each scale.
What are the potential risks of participating?
There are no potential risks.
What data will we collect?
The scores on each written script using the analytic scale. Some of the raters will then be interviewed.
What will we do with the data?
Analyze and compare the data using SPSS. After that, the data will be destroyed.
Will my participation be confidential?
The participants will be asked to sign the consent form and return it to me before being presented with the task in blank envelopes. Once the tasks have been completed, they will be asked to place them in the envelopes before submission, thus ensuring anonymity.
What will happen to the results of the research project?
The results of my study will be included in my PhD dissertation which will be publicly available in December 2014.
I confirm that I have read and understand the description of the research project, and that I have had an opportunity to ask questions about the project.
I understand that my participation is voluntary and that I am free to withdraw at any time without any negative consequences.
I understand that I may decline to answer any particular question or questions, or to do any of the activities. If I stop participating at all time, all of my data will be purged.
I understand that my responses will be kept strictly confidential, that my name or identity will not be linked to any research materials, and that I will not be identified or identifiable in any report or reports that result from the research.
I give permission for the research team members to have access to my anonymised responses.
I give permission for the research team to re-use my data for future research as specified above.
I agree to take part in the research project as described above.
Participant Name (Please print) Participant Signature
Researcher Name (Please print) Researcher Signature
Date
Note: If you have any difficulties with, or wish to voice concern about, any aspect of your participation in this study, please contact Dr. Angela Lin, Research Ethics Coordinator, Information School, The University of Sheffield (ischool_ethics@sheffield.ac.uk), or to the University Registrar and Secretary.
Appendix 2 Participants’ questionnaire- Background
Please provide information on the following:
1. My teaching qualification(s) is/are:
2. I have __________ years of teaching experience.
3. I have __________ years of teaching experience in Kuwait.
4. I am currently employed by ____________________________.
5. I am from ____________________ (country of birth).
6. 6. Throughout my career (study/work) I have taken at least one course in language testing/assessment:
Yes:___ No:___ Not sure:___
Appendix 3 The analytic rating scale.
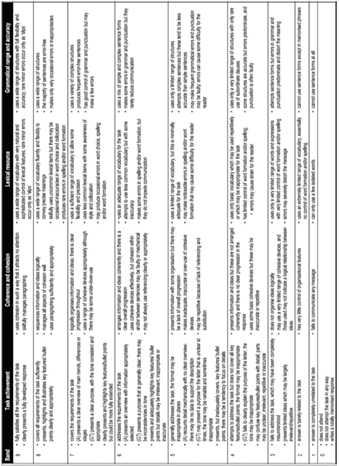

Appendix 4 Participants’ task
This research aims to find out how teachers of English rate students’ writing.
Please begin by timing yourself, then read the script and use the given rating scale to score the script. After that write down how long it took you in total to read and score the script. Also mention how many times you read the script before scoring it.
1. Using the given rating scale, please assign a score (1-6) to the following elements:
Task Achievement: _____
Coherence and cohesion: _____
Lexical resource: _____
Grammatical range and accuracy: _____
2. Time taken to score this script_____.
3. This script was read _____ times.
Appendix 5 NES raters’ profiles.
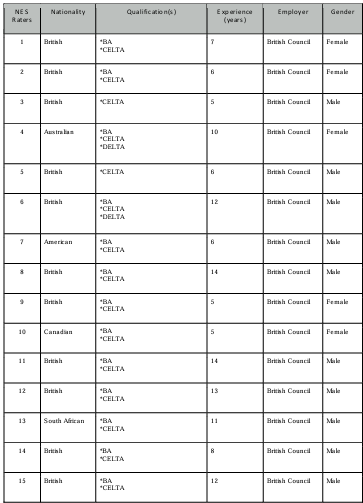

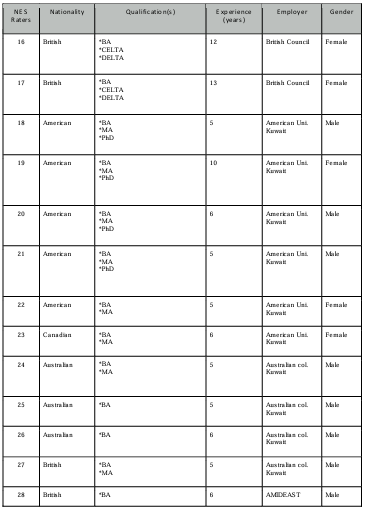

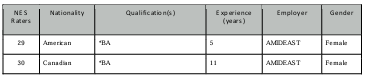

Appendix 6 NNS raters’ profiles